Matt Hobbs Head of Frontend, Lead Frontend Developer Government Digital Service @TheRealNooshu https://hachyderm.io/@TheRealNooshu Hello everyone! Firstly thanks to ?? for organising, and for allowing me to speak. My name’s Matt Hobbs.
Slide 1

Slide 2

I work at the This is a text slide Government Digital Service I’m the Head of Frontend at Government Digital Service (GDS). I’ve worked at GDS for almost 6 years. Before then I primarily worked in Digital Media Agencies both in the UK and Australia.
Slide 3

Why does frontend per formance matter? I’m here to give you my opinion of why web performance matters. This talk is primarily looking at this from the perspective of government services, but hopefully there will be key takeaways you can use in your own sectors too.
Slide 4

Who are GDS? There may be a few people here who haven’t heard of GDS before, so I will give you a brief rundown on who we are and what we do.
Slide 5
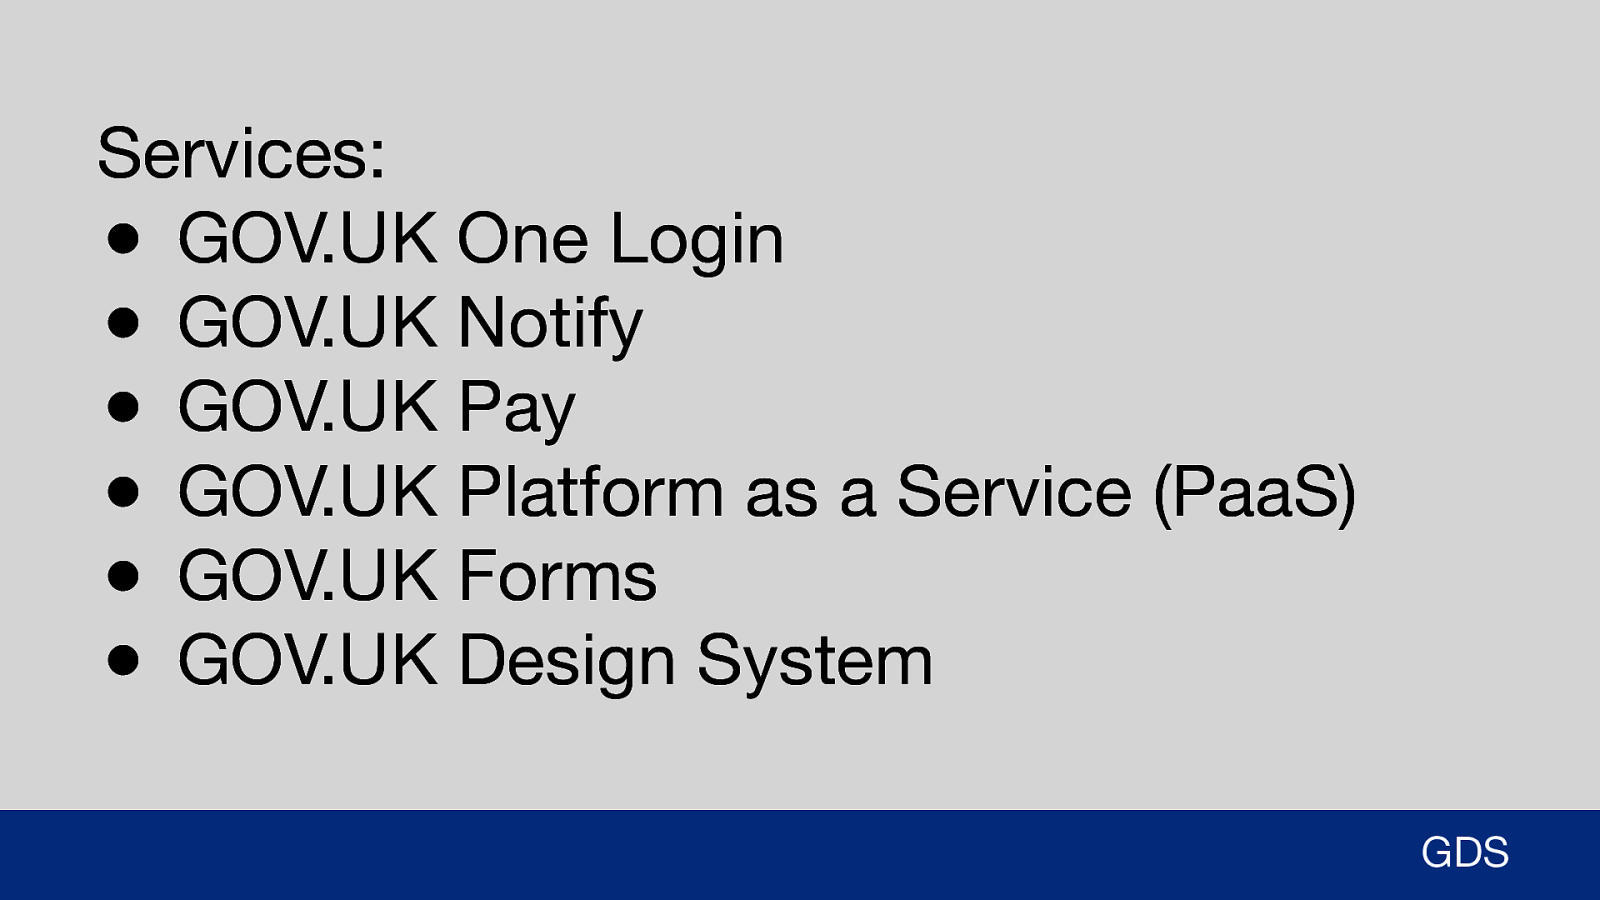
Services: ● GOV.UK One Login ● GOV.UK Notify ● GOV.UK Pay ● GOV.UK Platform as a Service (PaaS) ● GOV.UK Forms ● GOV.UK Design System GDS We’ve built and maintain a number of government services. For example: ● GOV.UK Pay is a secure payment service that is easily integrated into other government services. ● GOV.UK Notify lets service teams keep their users updated with emails, text messages and letters. ● GOV.UK Design System is a set of components, styles and patterns to help service teams across government build services that are consistent with GOV.UK.
Slide 6

GOV.UK But what we’re primarily known for is building and maintaining GOV.UK. GOV.UK is the central website for the UK government. It’s the best place to find policy, announcements, information about the government, and guidance for citizens. Since 2012 it has replaced 1,884 government websites with just one, to become the home of all central government’s online content and services.
Slide 7
695,000 pages, 25 ministerial departments Source: GOV.UK Content Data (January 2023) GDS As of the last count, GOV.UK has 695,000 content pages from 25 ministerial departments and hundreds of government organisations.
Slide 8
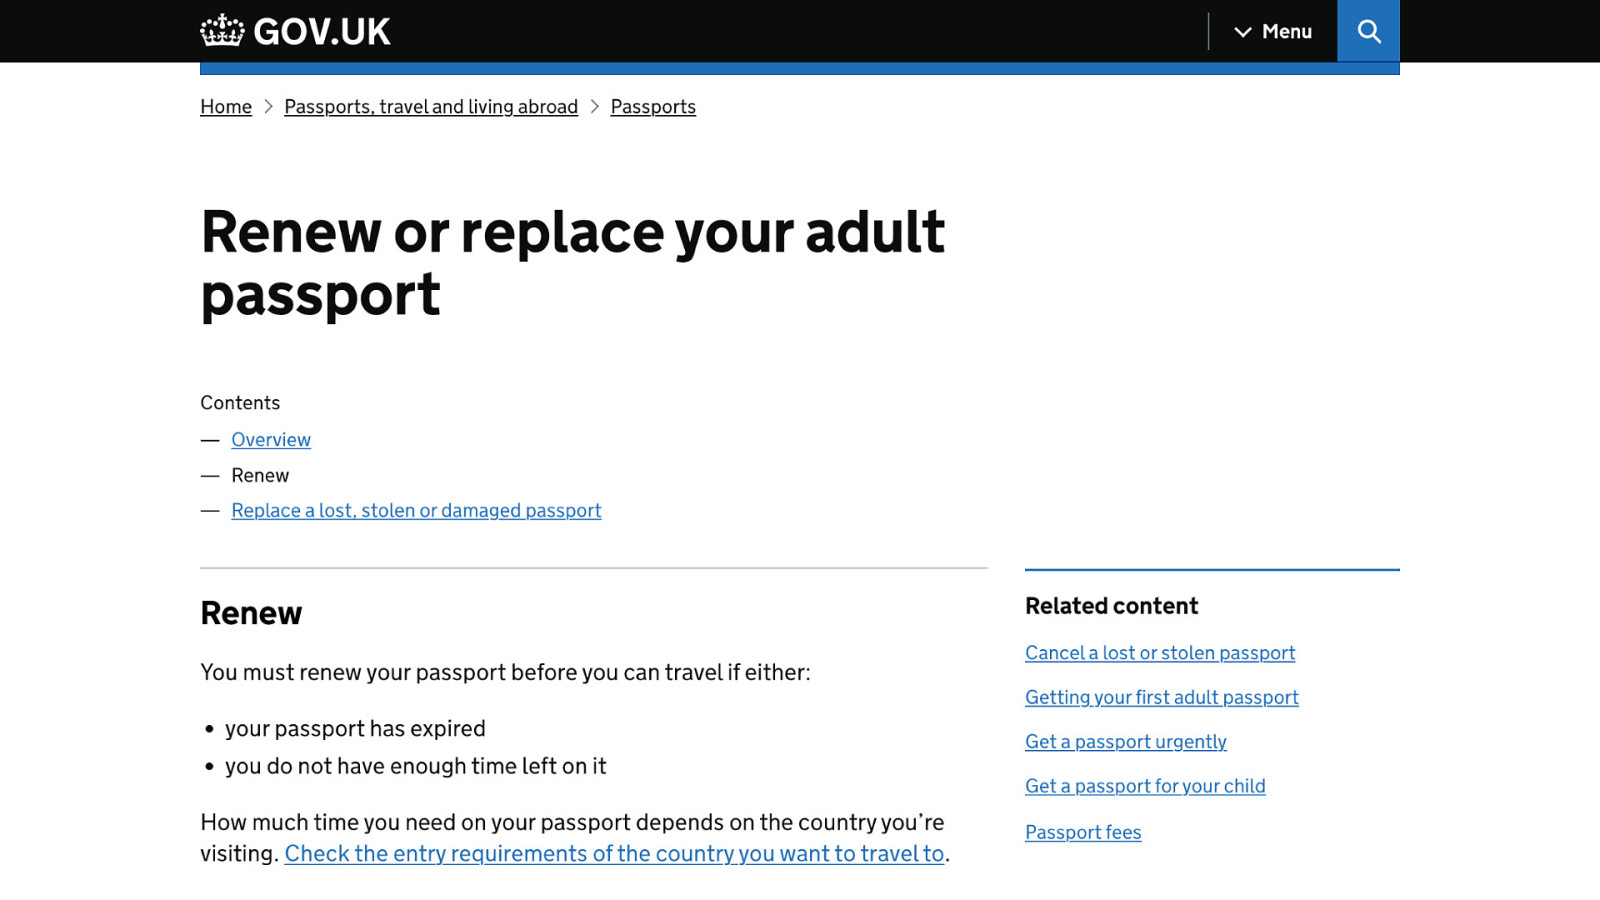
GOV.UK can help you renew or replace your passport…
Slide 9
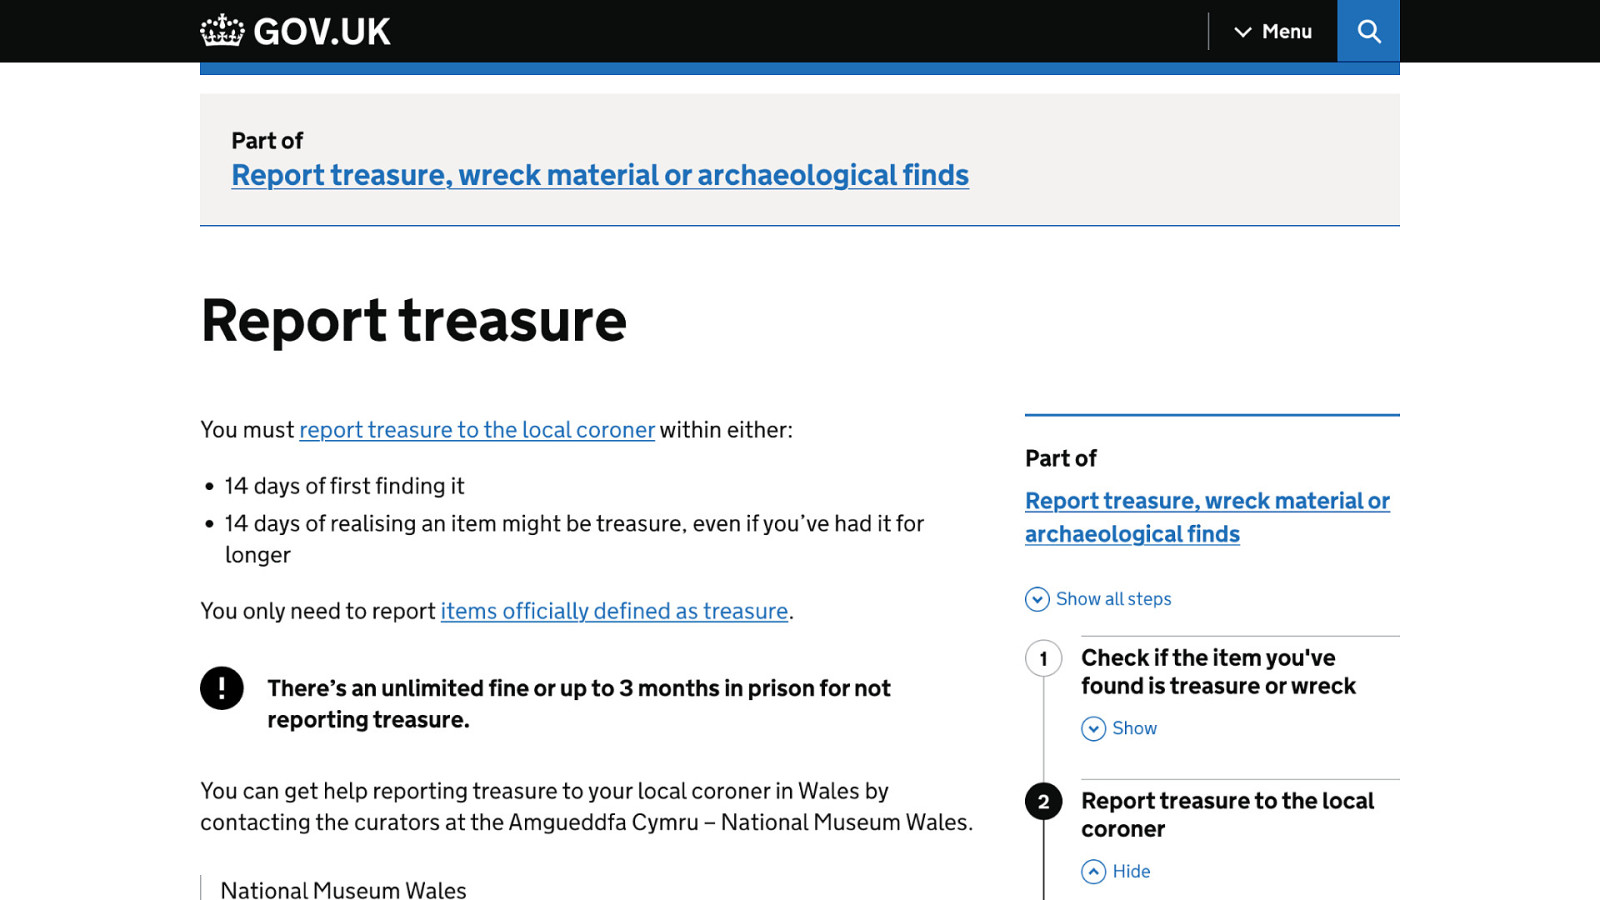
It can help you report buried treasure…
Slide 10
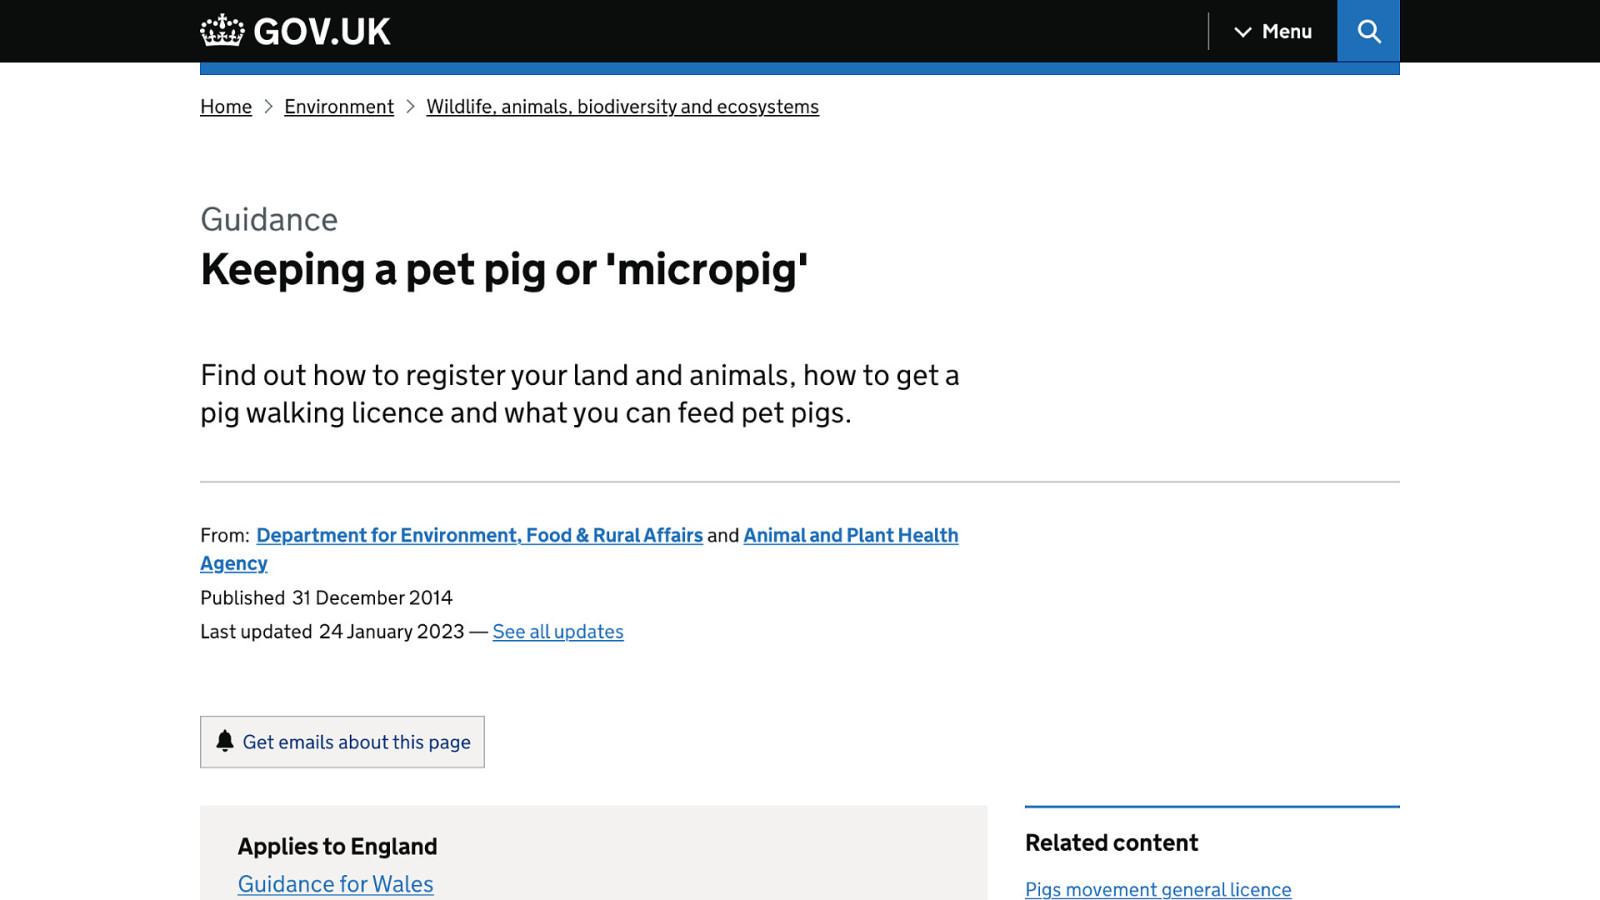
Or it can help you get a “micropig” licence to allow you to walk your pet pig. That page actually exists.
Slide 11
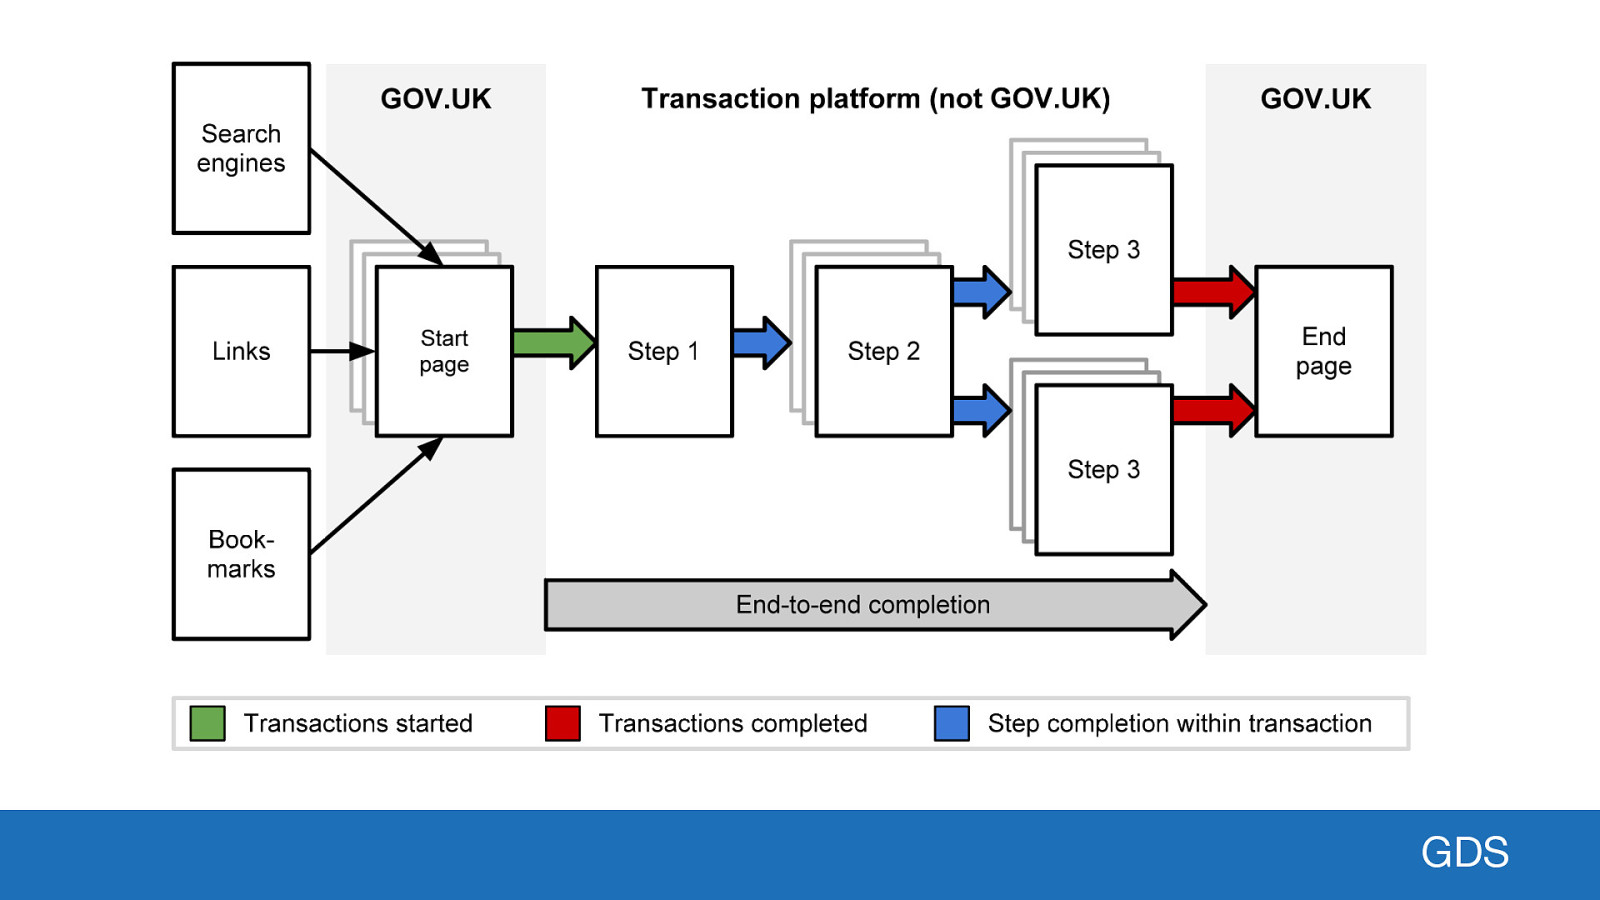
GDS GOV.UK hides the intricacies of government behind a single website and allows users to find trusted information and signposts to services. In regards to web performance, GOV.UK is the linchpin that ties everything together digitally for central government. If performance is poor, users are going to have a bad time.
Slide 12
Our Users When it comes to web performance, the experience of our users is of the utmost importance. So who are our users?
Slide 13
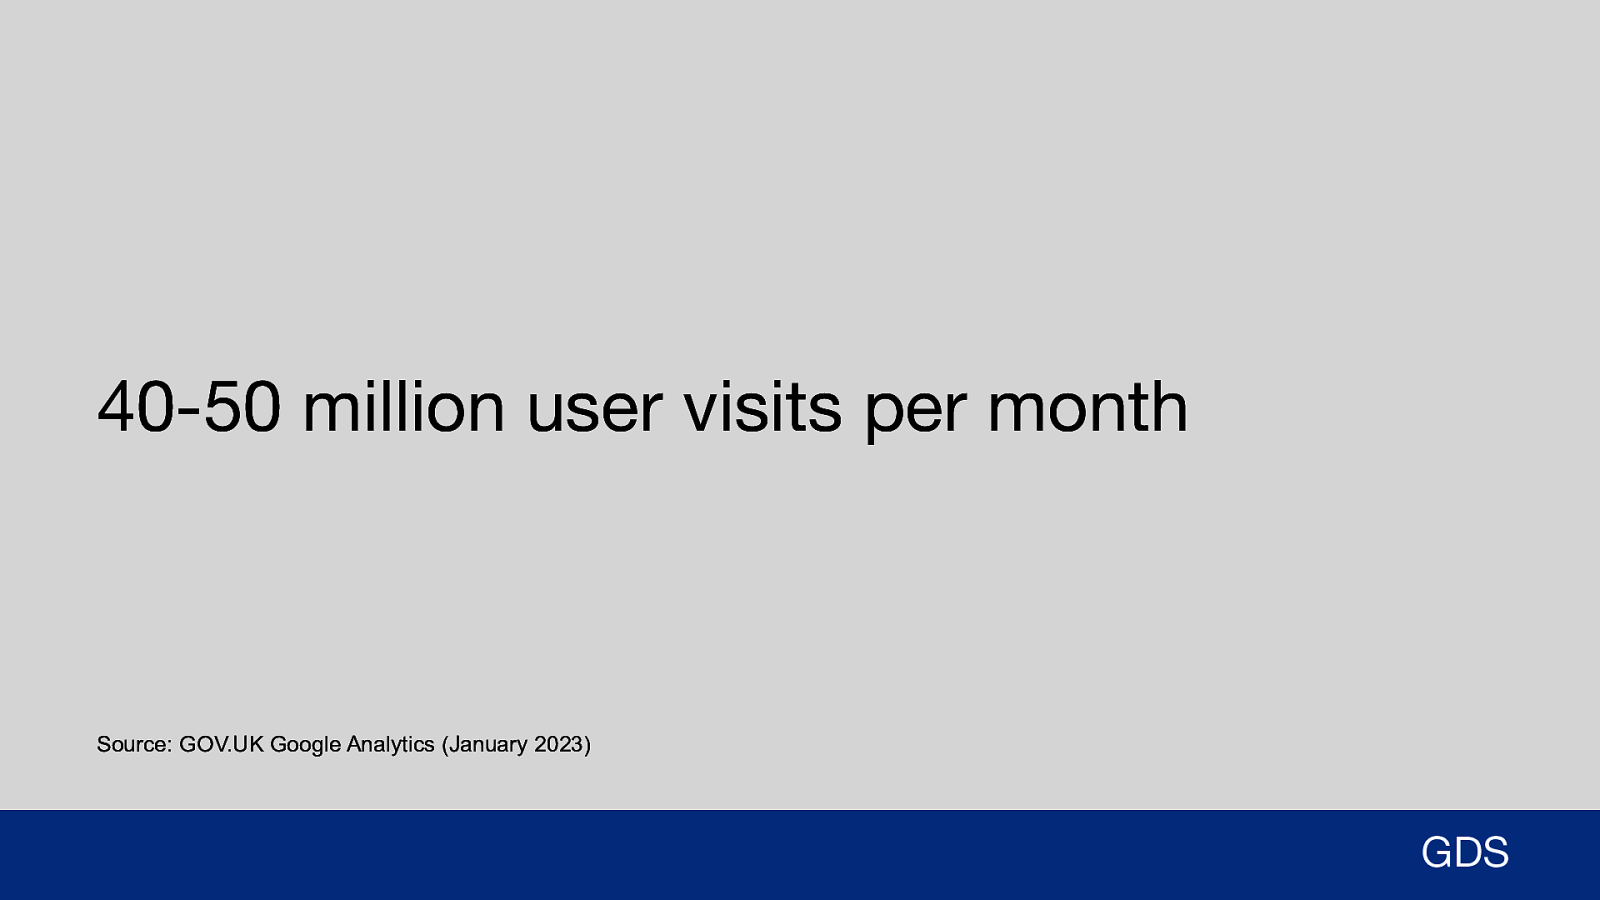
40-50 million user visits per month Source: GOV.UK Google Analytics (January 2023) GDS We have between 40-50 million user visits per month to GOV.UK. This is using the Google Analytics definition of a user. It doesn’t equate to that many people in practice. The same user could be returning to the site with a different browser or device.
Slide 14
80% of visits are from the United Kingdom Source: GOV.UK Google Analytics (January 2023) GDS A high percentage of users come from the United Kingdom, approximately 80%. The next largest percentage is from the US, at approximately 10%. The other 10% is made up of countries like Andorra, Benin, India, Spain. ● Many expats use GOV.UK One Login for their pension needs ● Foreign nationals use the visa service to apply and renew their visas
Slide 15
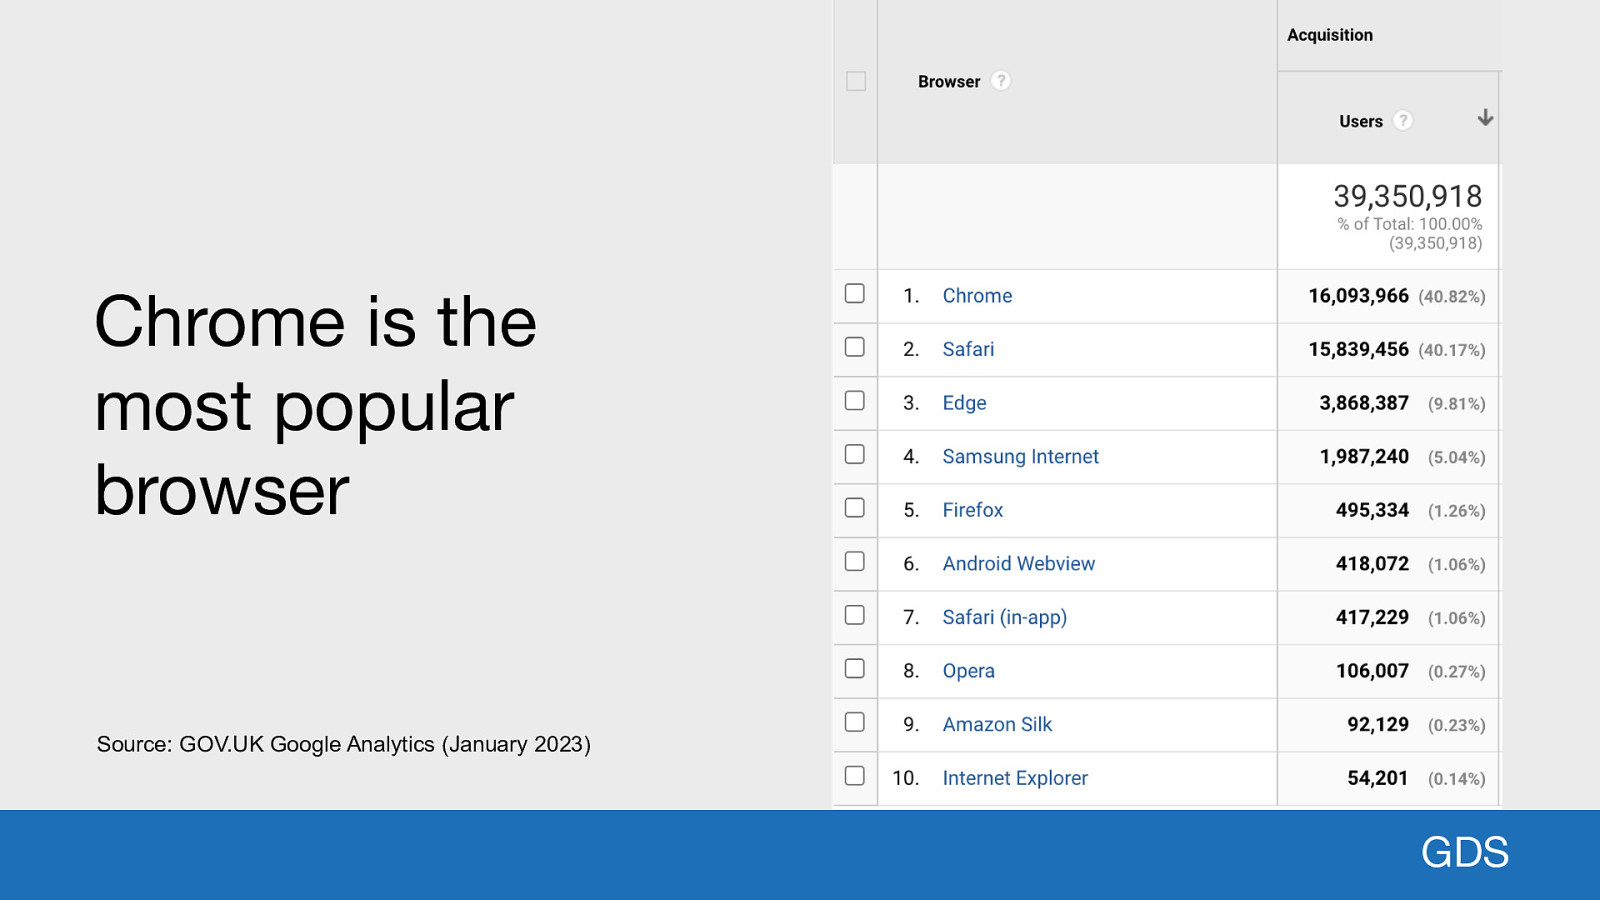
Chrome is the most popular browser Source: GOV.UK Google Analytics (January 2023) GDS The most popular browser visiting the site is Chrome (~41%), with Safari in second (~40%) and Internet Explorer third (~7%). These stats include mobile, tablet, and desktop devices. For Safari, 34% of those users are on the iOS (iPhone) version. 6% desktop, and 1% tablet.
Slide 16
Mobile is the most popular browsing device Source: GOV.UK Google Analytics (January 2023) GDS Mobile is now the most popular device users use to browse GOV.UK, with ~62% of users. Since February 2019 mobile has consistently had more users than desktop. Tablet has been holding steady at around 3% usage for a number of years now.
Slide 17
Demographics: ?? Source: ONS Principal projection data (2023) GDS I’d love to give you some solid information on demographics like age or gender, but I’m afraid we don’t track that information in our analytics. But what I’d guess is it’s all genders from the age of 15 years 9 months upwards, as that’s when you can first apply for a provisional driving licence in the UK. This equates to ~56 million people, or 82.7% of the population according to the Office for National Statistics.
Slide 18
User Stories Now we know a little bit about GOV.UK users, how does web performance affect them on a daily basis? I have three user stories I can share with you. These are all true and have been reported to us via various channels. Names have been changed to protect their privacy.
Slide 19
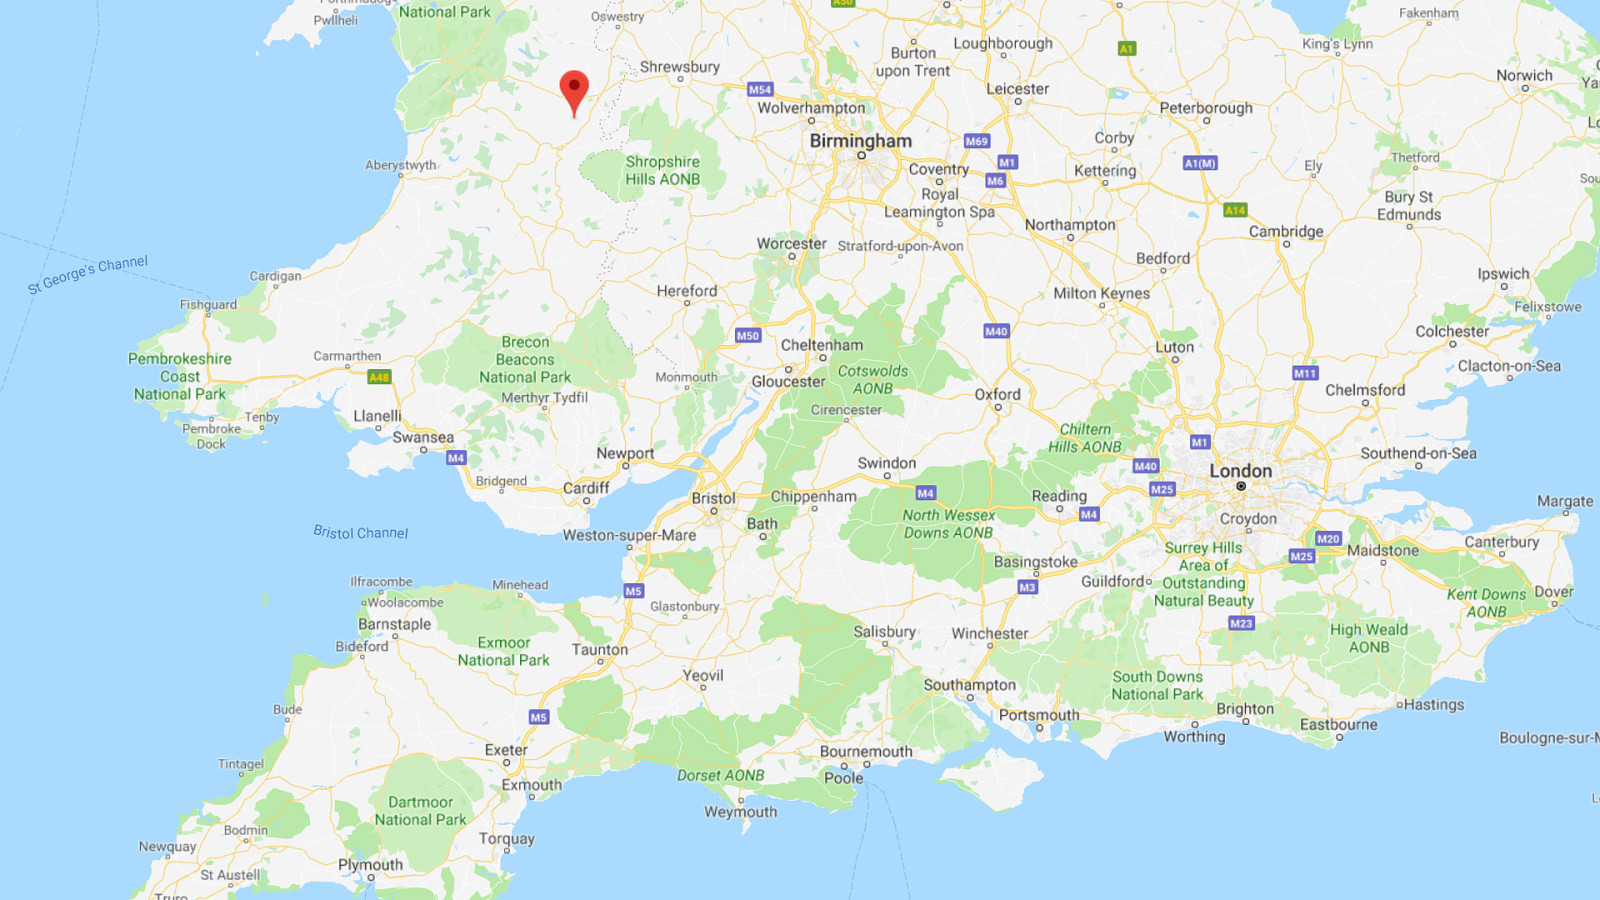
The first is Colin, a farmer in Welshpool, mid Wales. He lives in a remote area of the country. He has a broadband internet connection, but it’s shared between his neighbours. Because of this he’s found that the perfect time for him to complete his government service admin tasks is at 4 in the morning, when nobody else is using the internet in the area. His connection is so slow later in the day, the service is so unpleasant to use, he simply won’t use it.
Slide 20
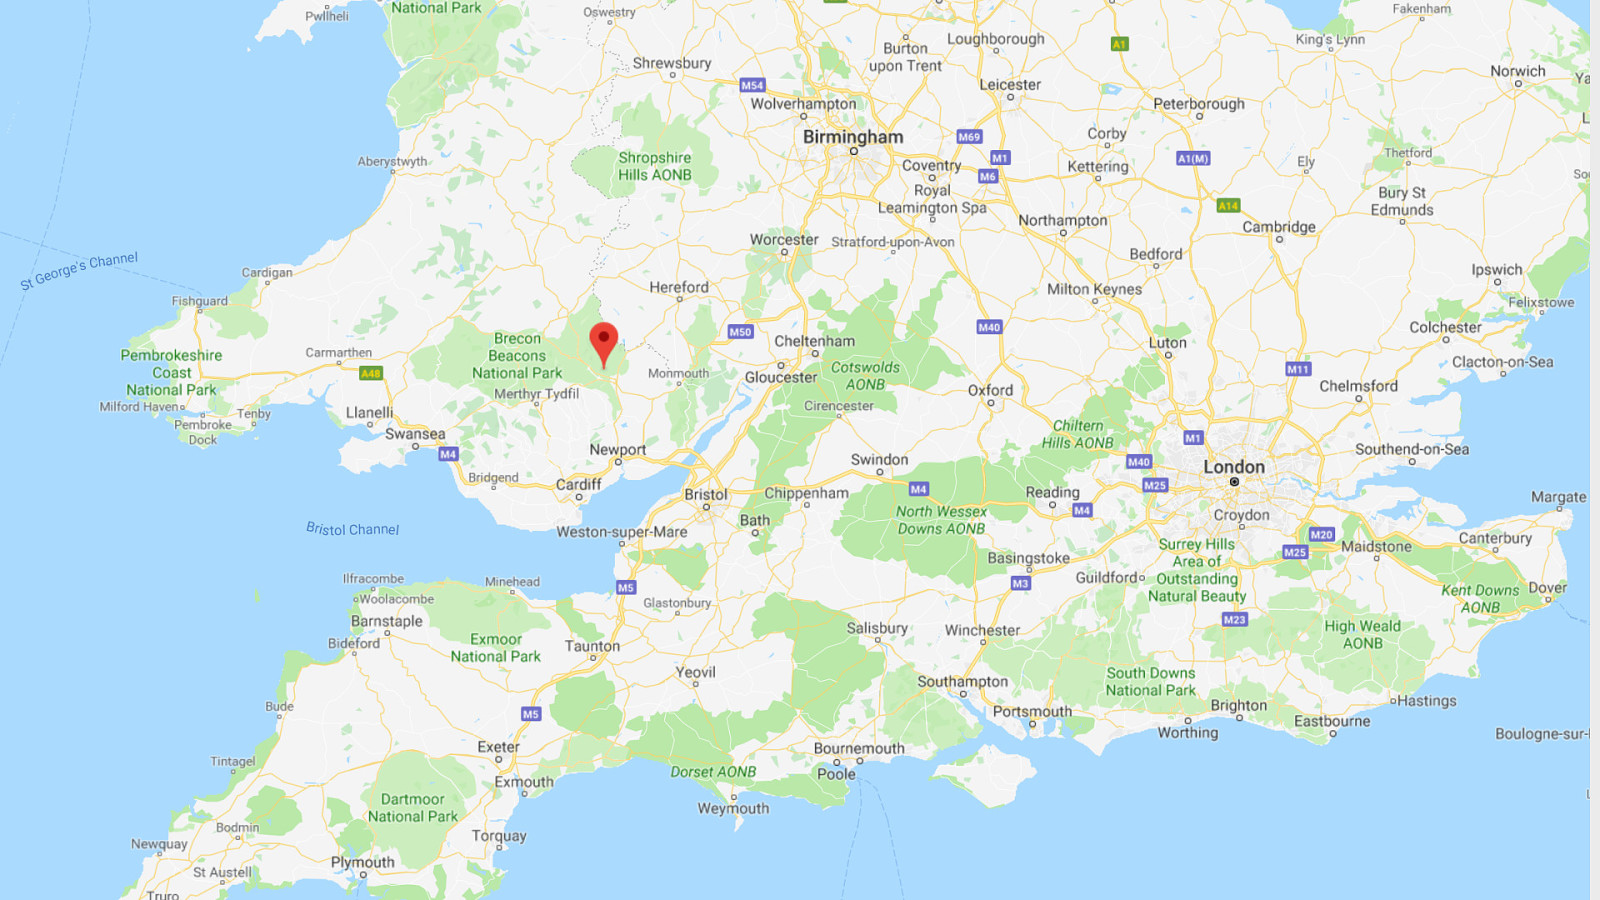
The second is David and Sarah, a couple who live on the outskirts of Abergavenny, south Wales. When filling out their DBS Check profile, they experienced errors that they assumed they were responsible for. On investigation it was the speed and stability of their broadband connection that was causing the issues. It was so poor the connection was disconnecting and the service simply timed out while trying to complete the task.
Slide 21
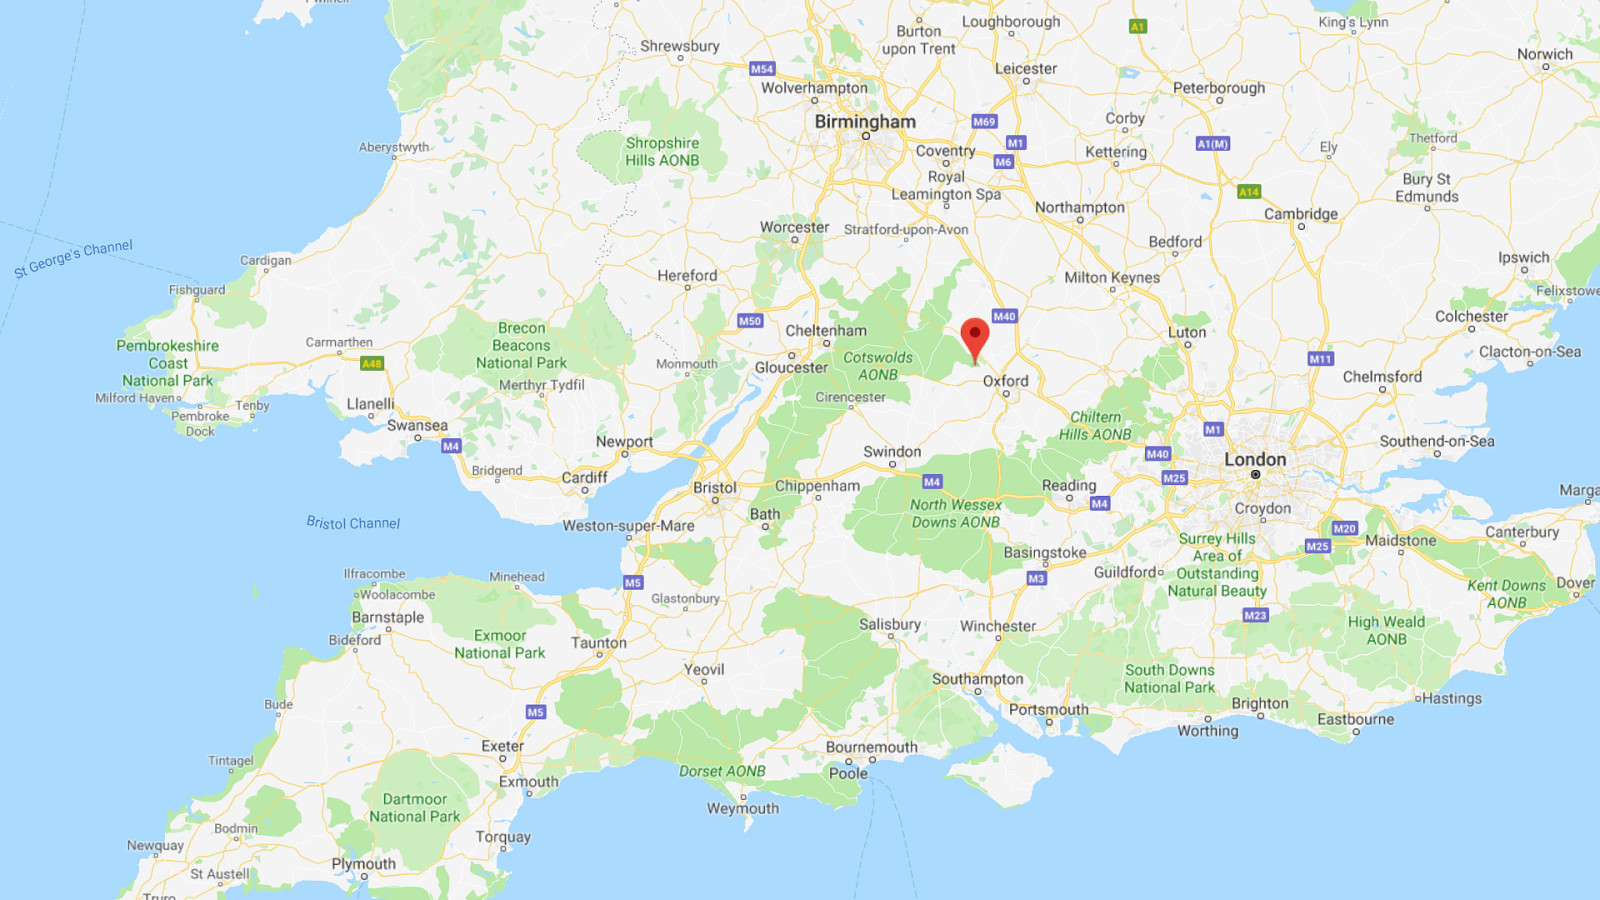
And lastly, a little closer to home (for me at least). My mother-in-law, Jean, who lives close to Woodstock in Oxfordshire. She has a broadband connection, but it’s slow and unreliable. She has an iPhone, but she can only get reception in one part of her house, and only if you are upstairs and stand next to the window in one particular bedroom. After much frustration trying to tax her vehicle, she ended up completing the task at my house some 35 minutes away in Bicester.
Slide 22
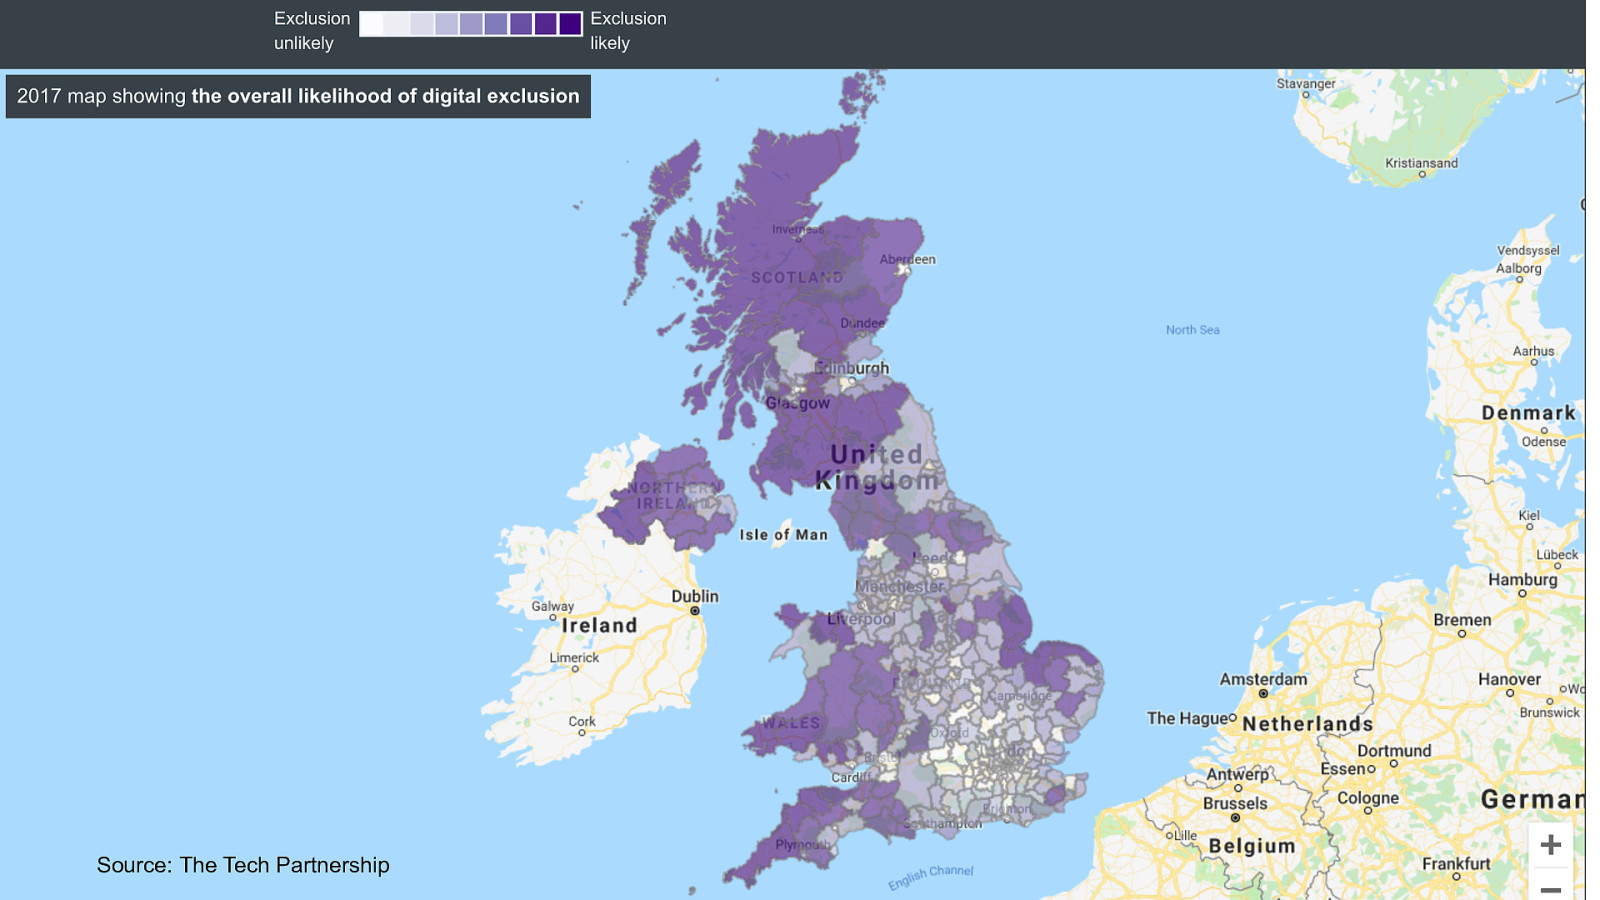
Source: The Tech Partnership In 2017 the Tech Partnership updated what is called the “Digital Exclusion Heatmap”. This map shows the likelihood of digital exclusion across the UK at a local authority level. The deep purple color is “exclusion likely”. Clear colour is “exclusion unlikely”. The map uses eight different digital and social metrics to calculate the overall likelihood of exclusion. This includes open-source data related to: ● age ● education ● Broadband & mobile infrastructure We have three users who are experiencing poor web performance, so let’s see where they appear on this map…
Slide 23
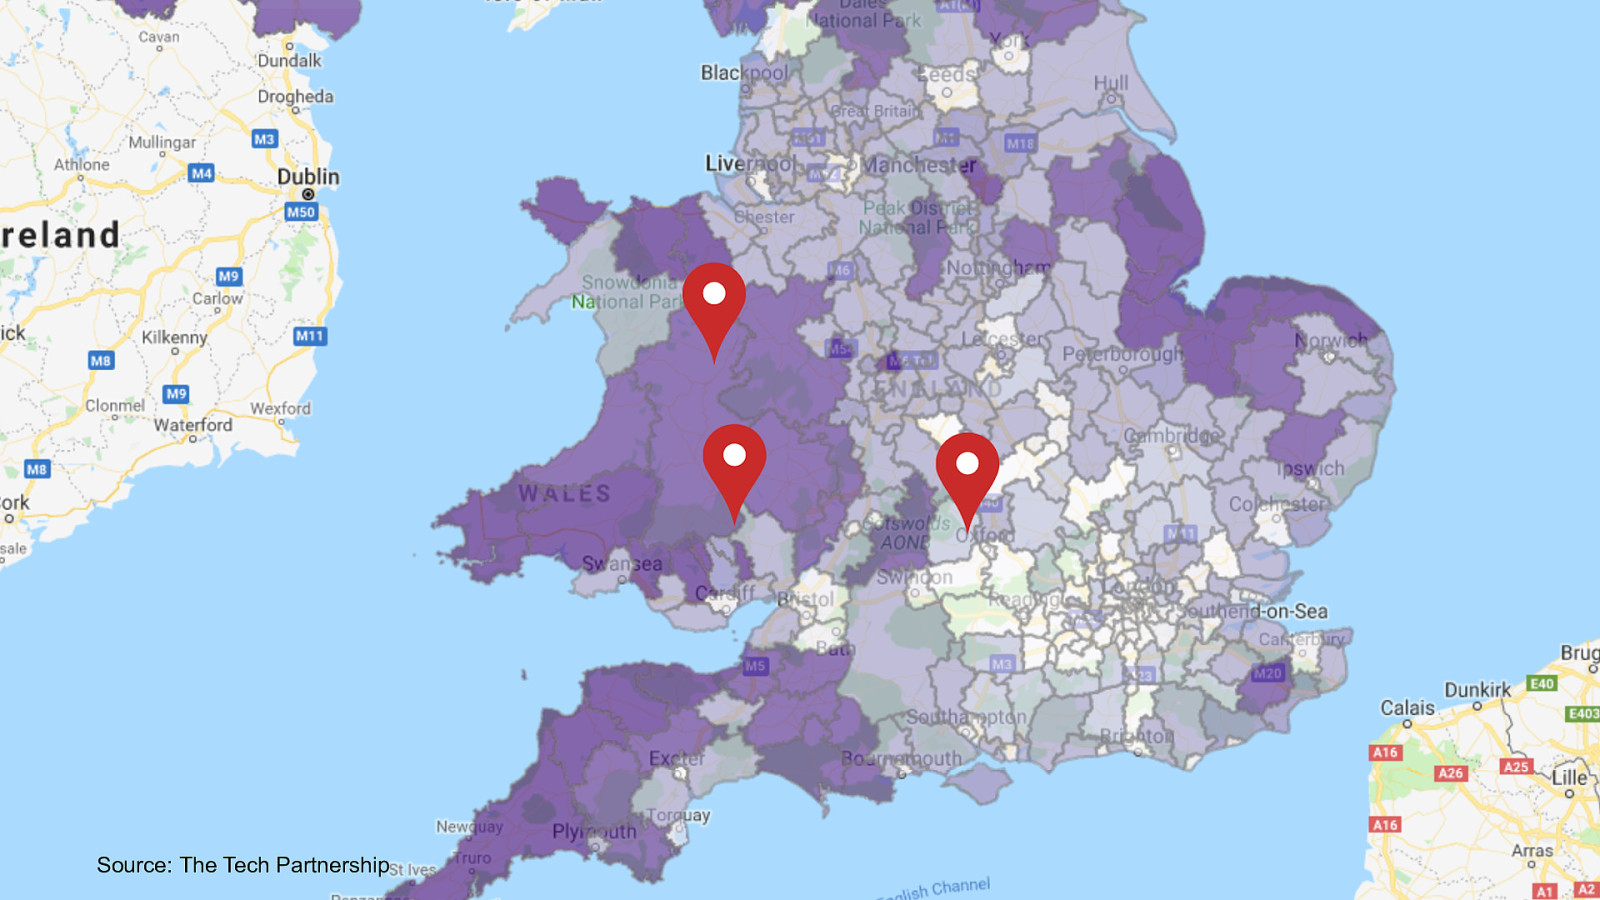
Source: The Tech Partnership As you can see two of the stories, Colin, and David and Sarah from Wales are in a deep purple section of the map. These are areas that are very likely to have digital exclusion. The third marker based in Oxfordshire sits somewhere between likely and unlikely to have digital exclusion. Now these are just 3 user stories from these digital exclusion areas. Look how much purple you can see on the map and the actual population it covers. These example stories aren’t going to be a rare occurrence. Many people will be having these performance issues across the whole of the UK.
Slide 24
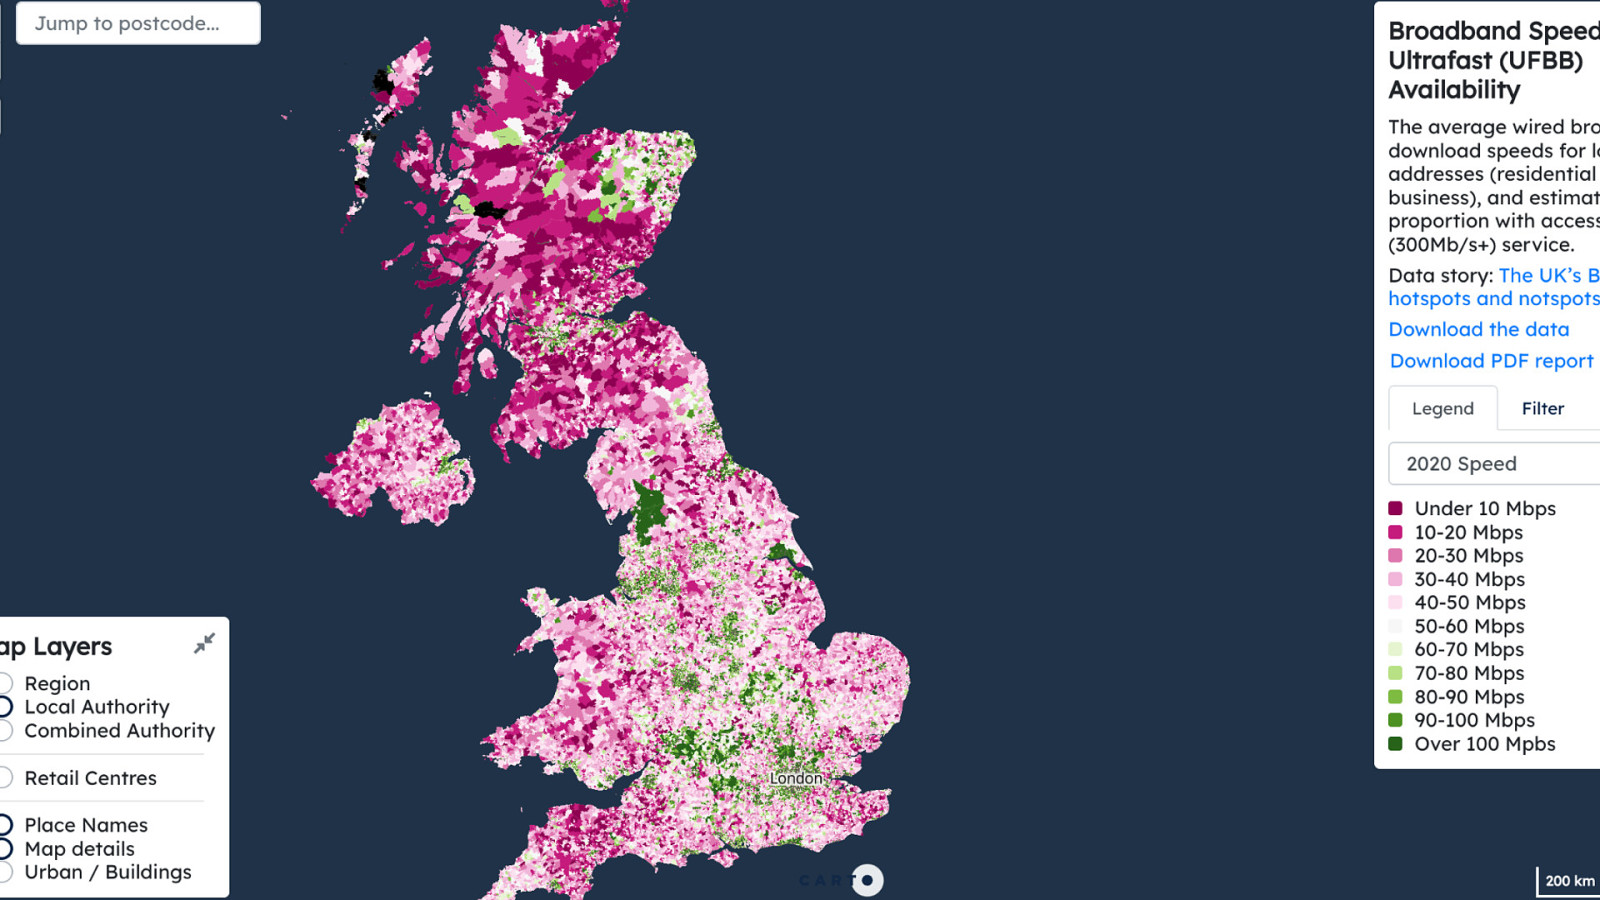
GDS Unfortunately the original study hasn’t been updated since 2017, So I’ve had to use a different data source from the Consumer Data Research Centre (CDRC). This map shows in really fine detail down to the local authority level a users broadband availability in their local area. As you can see there are many dark red areas of the map mainly in rural areas that have under 10 Mbps or less available to them. Now when you consider Netflix for example recommends 5 Mbps for HD streaming on a stable connection, that doesn’t leave a lot of headroom for other users in a household!
Slide 25

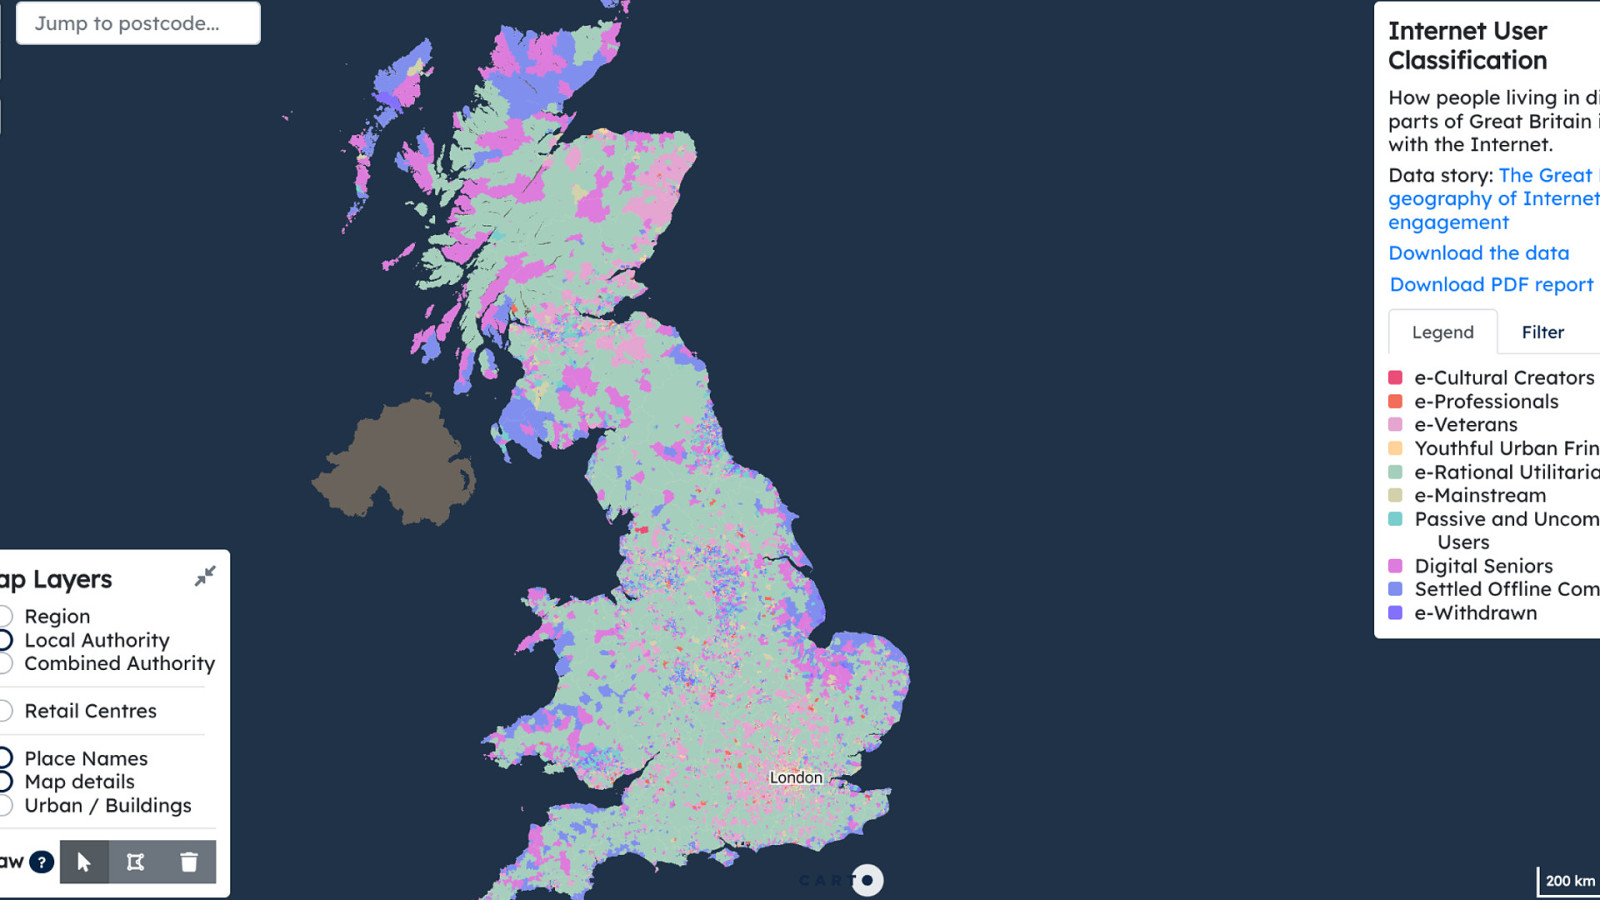
GDS Here’s another interesting map from the CDRC, this one classifies what the UK population mainly uses the internet for. As you can see there’s a lot of light green all over the country. The light green colour has a classification of “e-rational Utilitarians”.
Slide 26
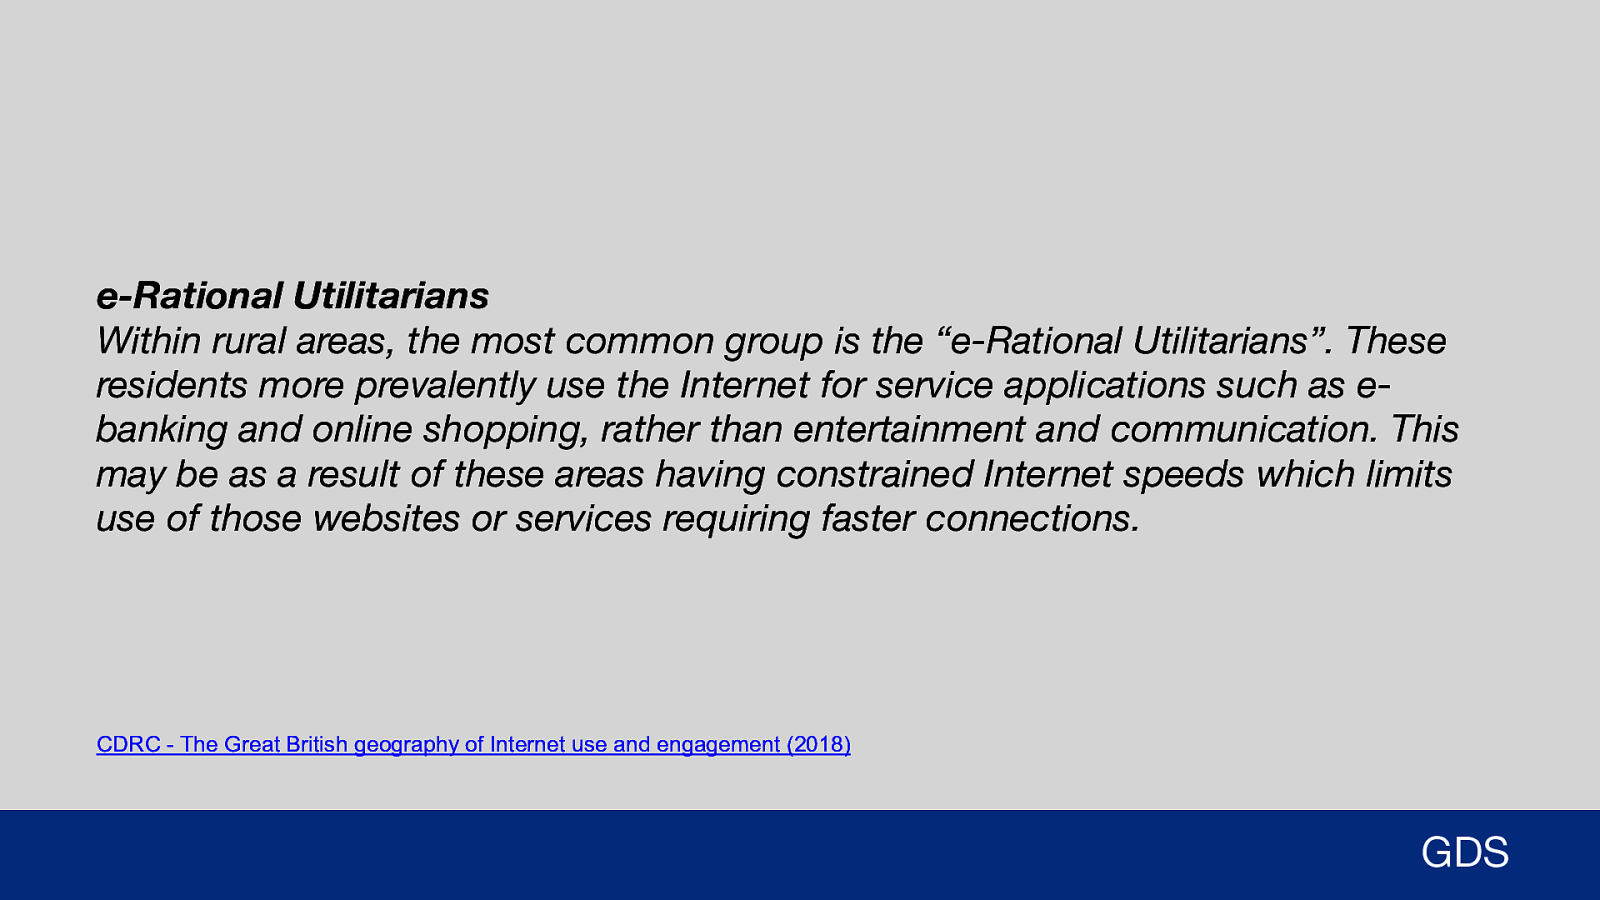
e-Rational Utilitarians Within rural areas, the most common group is the “e-Rational Utilitarians”. These residents more prevalently use the Internet for service applications such as ebanking and online shopping, rather than entertainment and communication. This may be as a result of these areas having constrained Internet speeds which limits use of those websites or services requiring faster connections. CDRC - The Great British geography of Internet use and engagement (2018) GDS The definition of e-Rational Utilitarians set by the CDRC is given above. It says: Within rural areas, the most common group is the “e-Rational Utilitarians”. These residents more prevalently use the Internet for service applications such as e-banking and online shopping, rather than entertainment and communication. This may be as a result of these areas having constrained Internet speeds which limits use of those websites or services requiring faster connections.
Slide 27
GDS Going back to the map you can now see how many rural users only really use the internet for specific tasks like online shopping and e-banking, not entertainment because of constraints with their internet connection. That’s a huge percentage of the country who are looking for websites that are fast and efficient because they don’t have a connection capable of being used on their internet connection. If you’re a business with a slow performing website, just look at how many potential customers you are excluding from your website! That’s a lot of missed opportunities for sales. Or if you’re a charity, seeking funding and volunteers make sure everyone can access the site, no matter what connection or device a user uses!
Slide 28

GOV.UK Coming back to GOV.UK, this is why we try to build for all users, including those on poor connections and slow devices. More on web performance on slow devices in the coming slides.
Slide 29

User Devices When optimising web performance, it’s important to consider what devices users are using to access government services. So let’s look into that for GOV.UK.
Slide 30
~9,000 mobile devices listed Source: GOV.UK Google Analytics (January 2023) GDS On GOV.UK we have ~9,000 mobile devices listed accessing the site.
Slide 31
~16,000 mobile device & operating system version combinations Source: GOV.UK Google Analytics (January 2023) GDS We have just under ~16,000 mobile device and operating systems combinations.
Slide 32
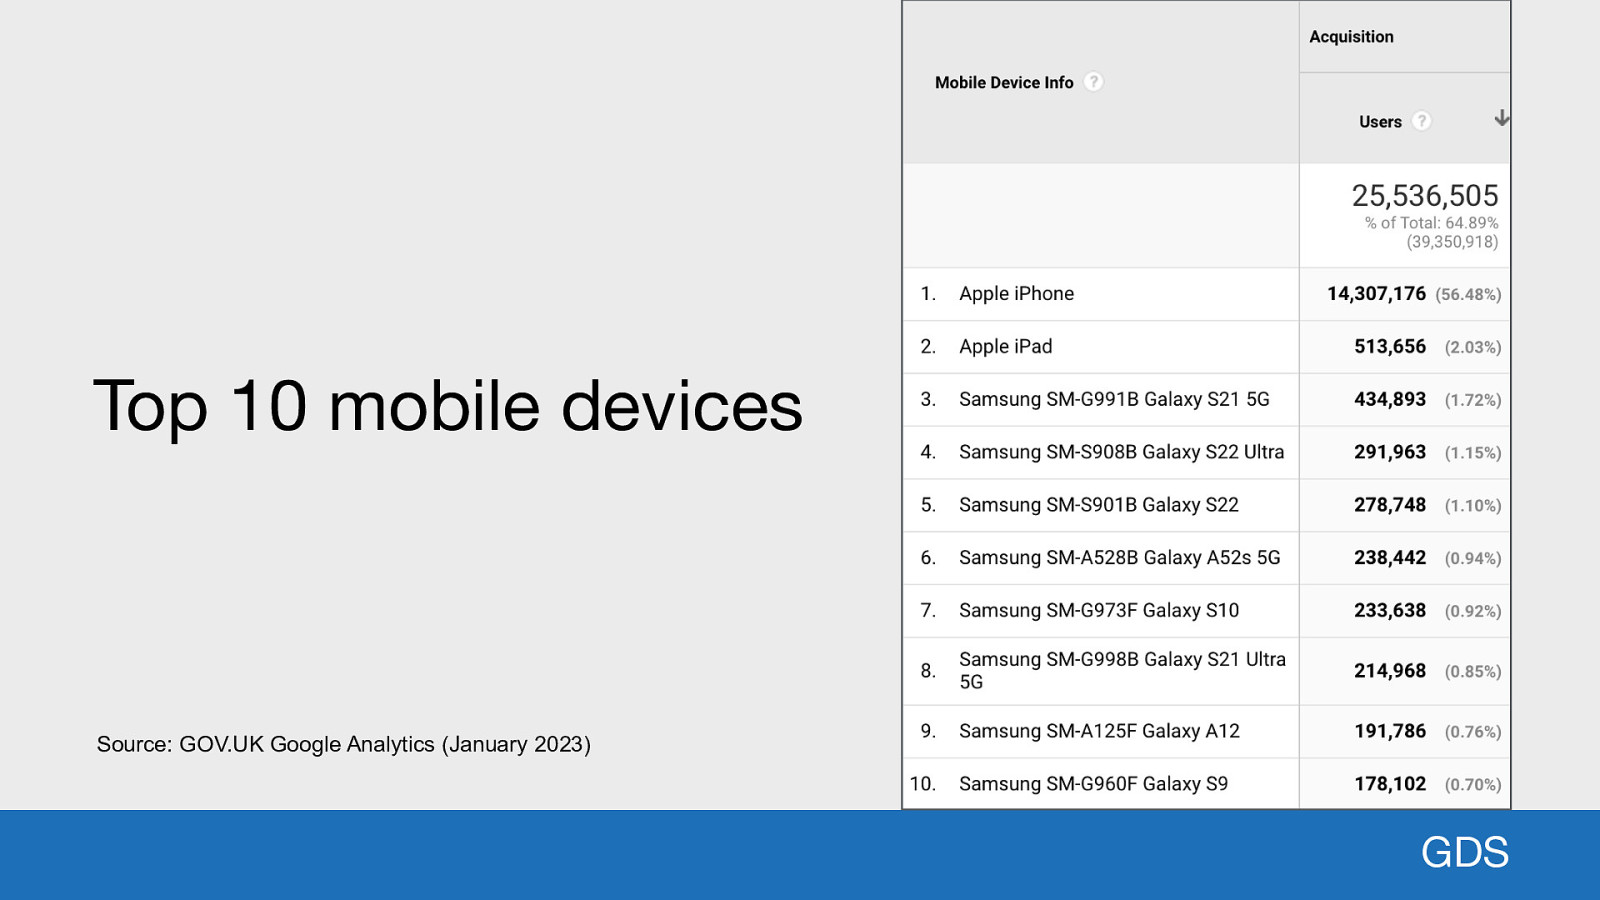
Top 10 mobile devices Source: GOV.UK Google Analytics (January 2023) GDS By far the most popular mobile device is the iPhone. It’s used by ~56% of mobile users. This is followed by the iPad with ~2% usage and a number of Android devices including the Samsung S21, S22 and S52s. But many of these devices are classed as “modern” with high-end specifications. When it comes to web performance, I’m more interested in the other end of the spectrum.
Slide 33
Not all users can afford high-end devices GDS As it’s important to remember that not all users can afford the latest top of the range mobile phone or laptop. Many users may be using devices that are a number of years old, possibly passed down from family members or purchased second-hand. So what devices are our users using that would be classed as “legacy”?
Slide 34

Definition The first problem: what’s the definition of a “legacy” device? Could you examine the CPU & RAM available in each device and classify it from that? Possibly. But with thousands of device combinations, that’s going to take a long time!
Slide 35
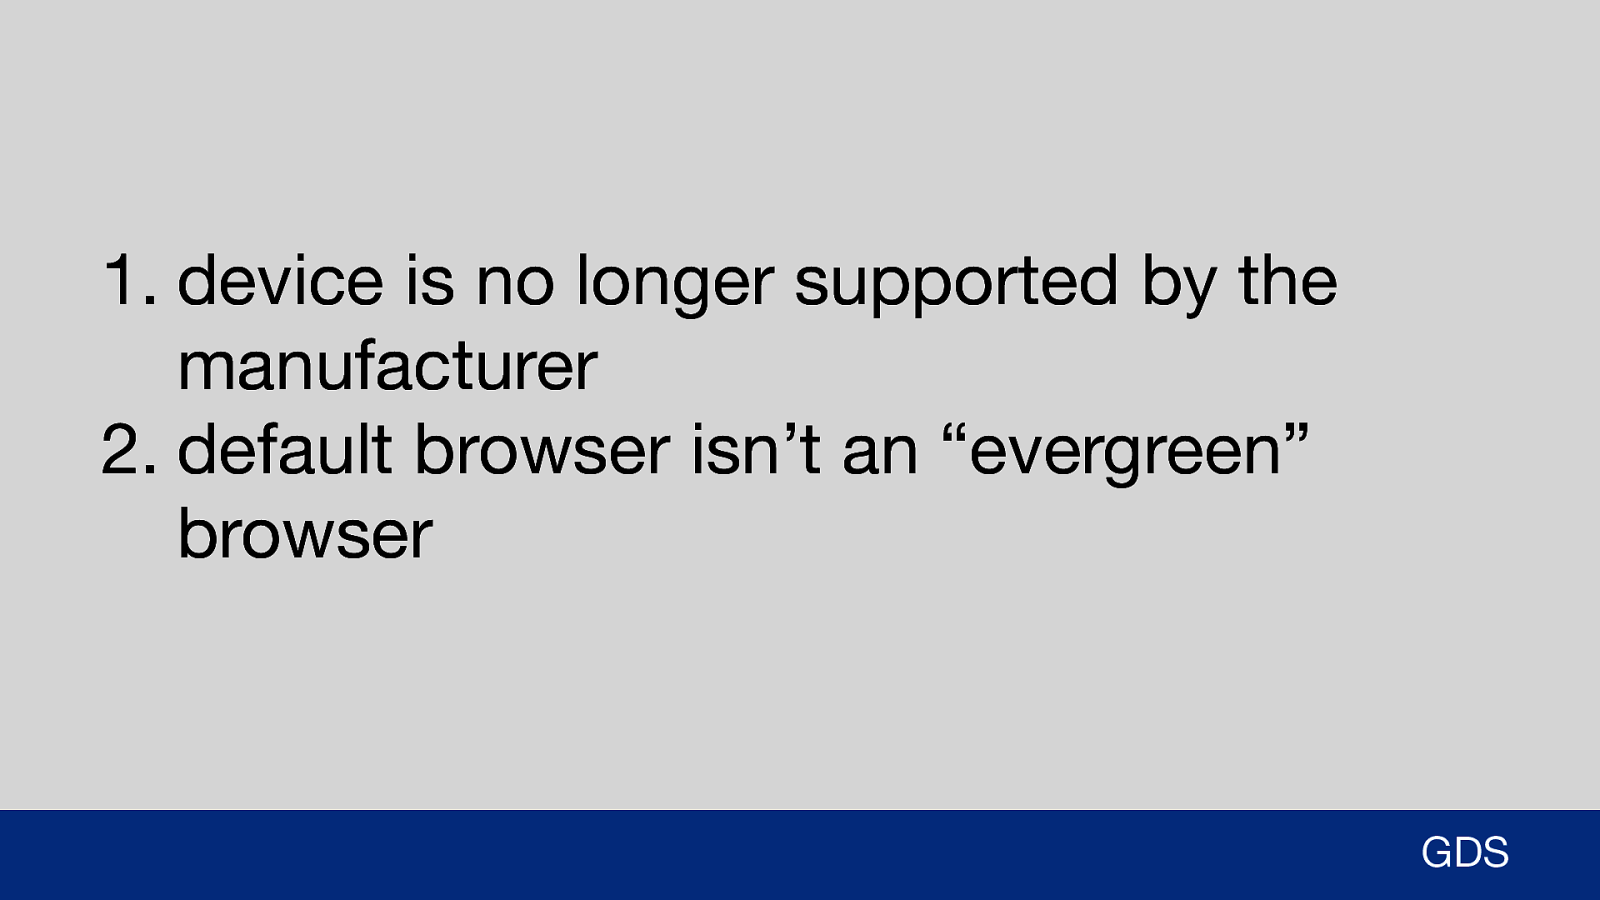
- device is no longer supported by the manufacturer 2. default browser isn’t an “evergreen” browser GDS I eventually settled on a definition that I thought worked well. A device is defined as legacy (by me) if either of these statements is true: 1. The device is no longer supported by the manufacturer (they have declared it legacy) OR 2. The devices default browser doesn’t auto-update A browser that auto-updates is known as an “evergreen” browser. The term exists because there are many browsers that are tied to specific operating system versions, and therefore cannot be updated.
Slide 36
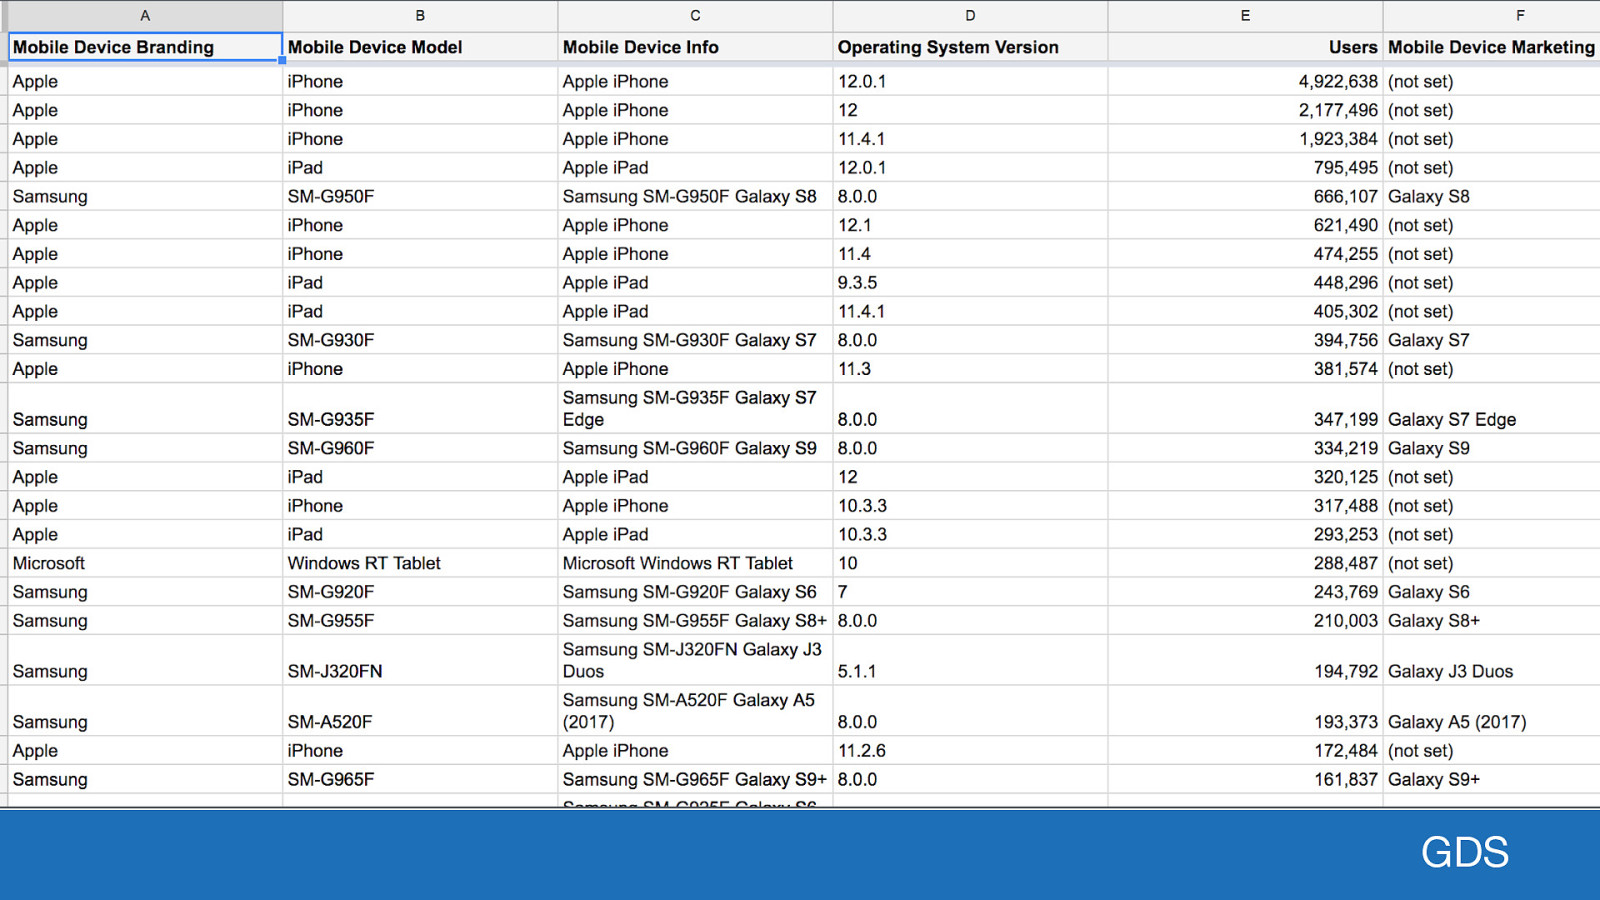
GDS Exporting the data from Google Analytics gave me a long spreadsheet like this.
Slide 37
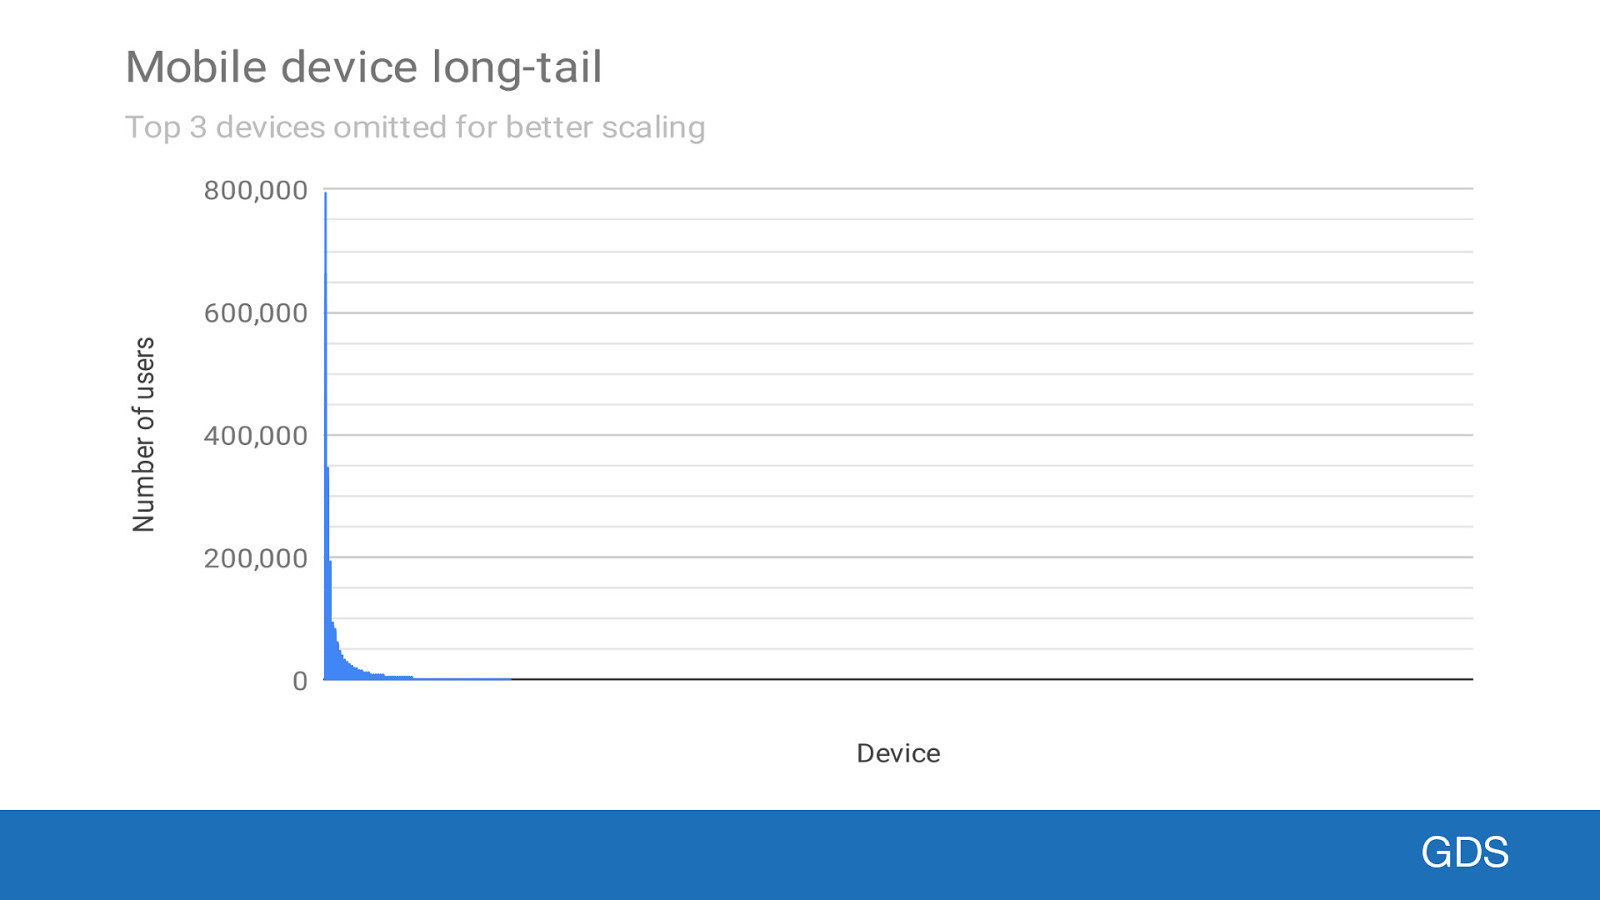
GDS A graph of this sheet gives you an idea of the “long tail” involved in this data. The long flat line you see isn’t an error in the graph, they are all devices with a low number of users. Just under 4000 device and OS combinations. The data set would have been larger, but GA only exports data with 100 users or more.
Slide 38

So I began the tedious work of looking at each of the devices and looking to see: ● ● ● ● what OS they shipped with what the OS update path is when were they last updated what’s their default browser For each device I could then answer a simple question: “Is the device legacy?” yes or no.
Slide 39

Results So the results I’ve found very interesting:
Slide 40
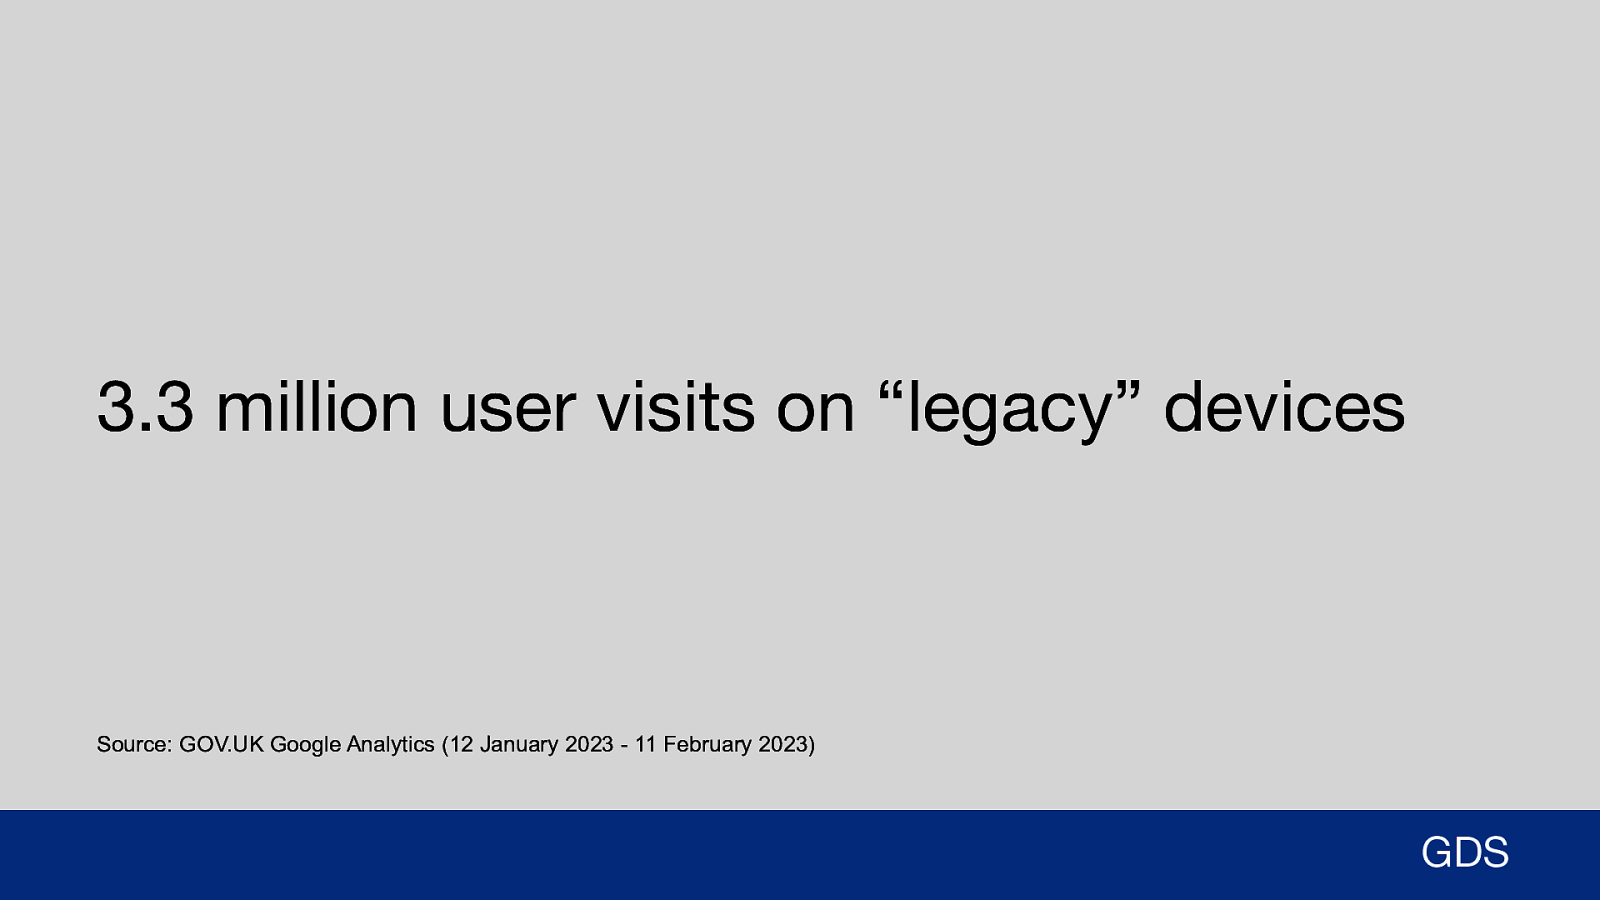
3.3 million user visits on “legacy” devices Source: GOV.UK Google Analytics (12 January 2023 - 11 February 2023) GDS In the 30 days of data I examined we had 56 million “users” visit GOV.UK. Of those around 59% were on mobile devices, or approximately 33 million “users”. From the data I’ve sorted, approximately 3.3 million user visits were on legacy devices…
Slide 41
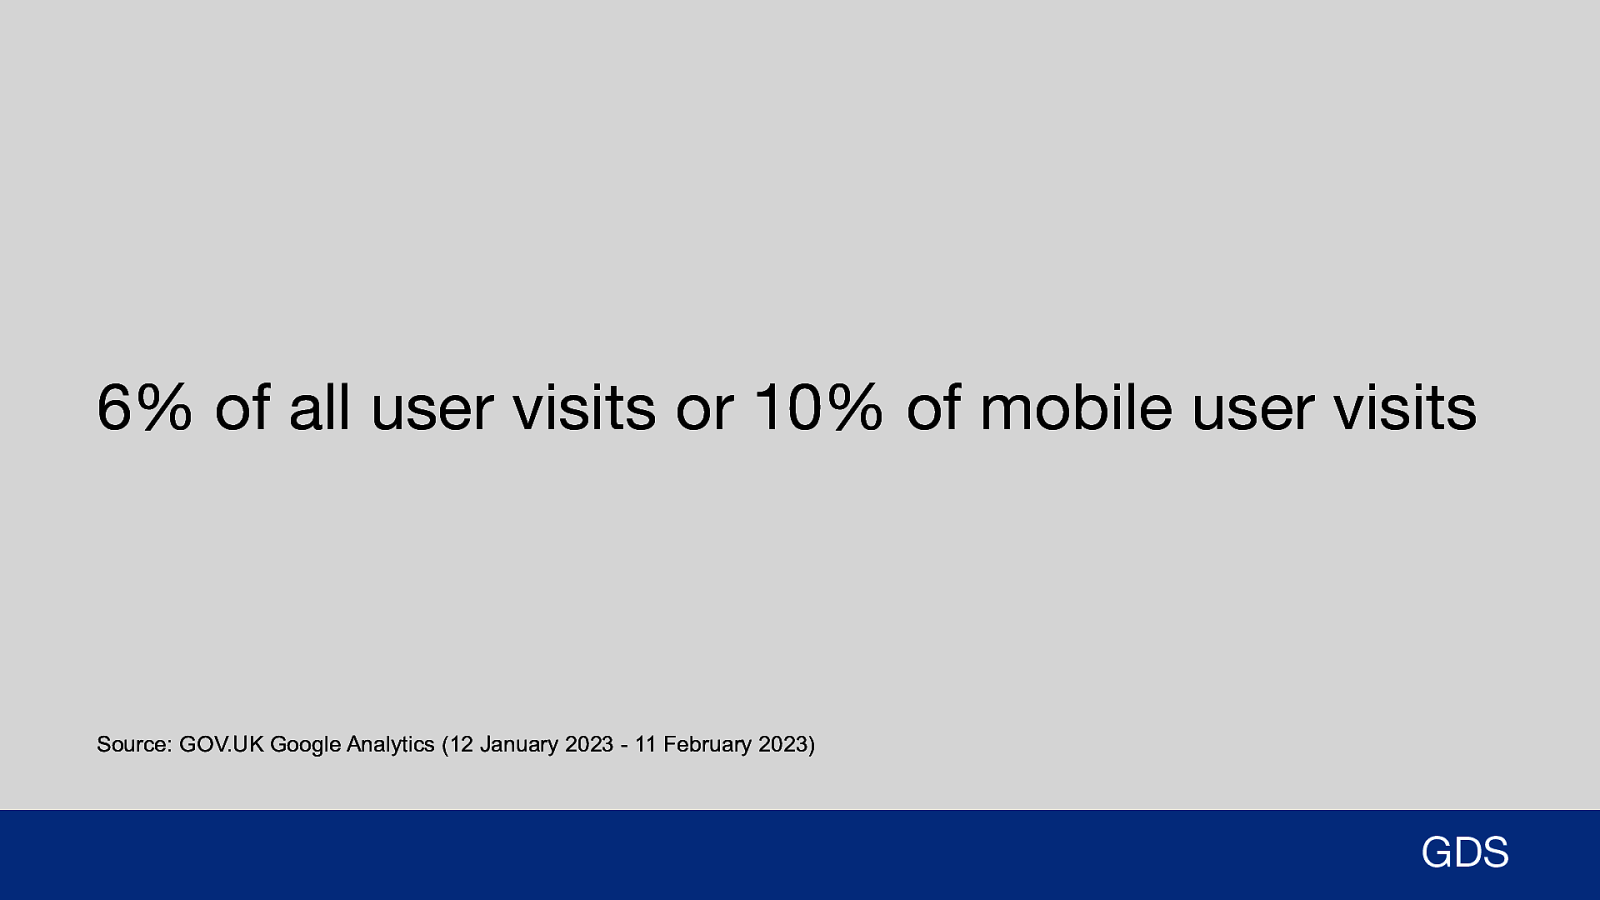
6% of all user visits or 10% of mobile user visits Source: GOV.UK Google Analytics (12 January 2023 - 11 February 2023) GDS …this works out to be approximately 6% of all user visits, or 10% of mobile user visits.
Slide 42
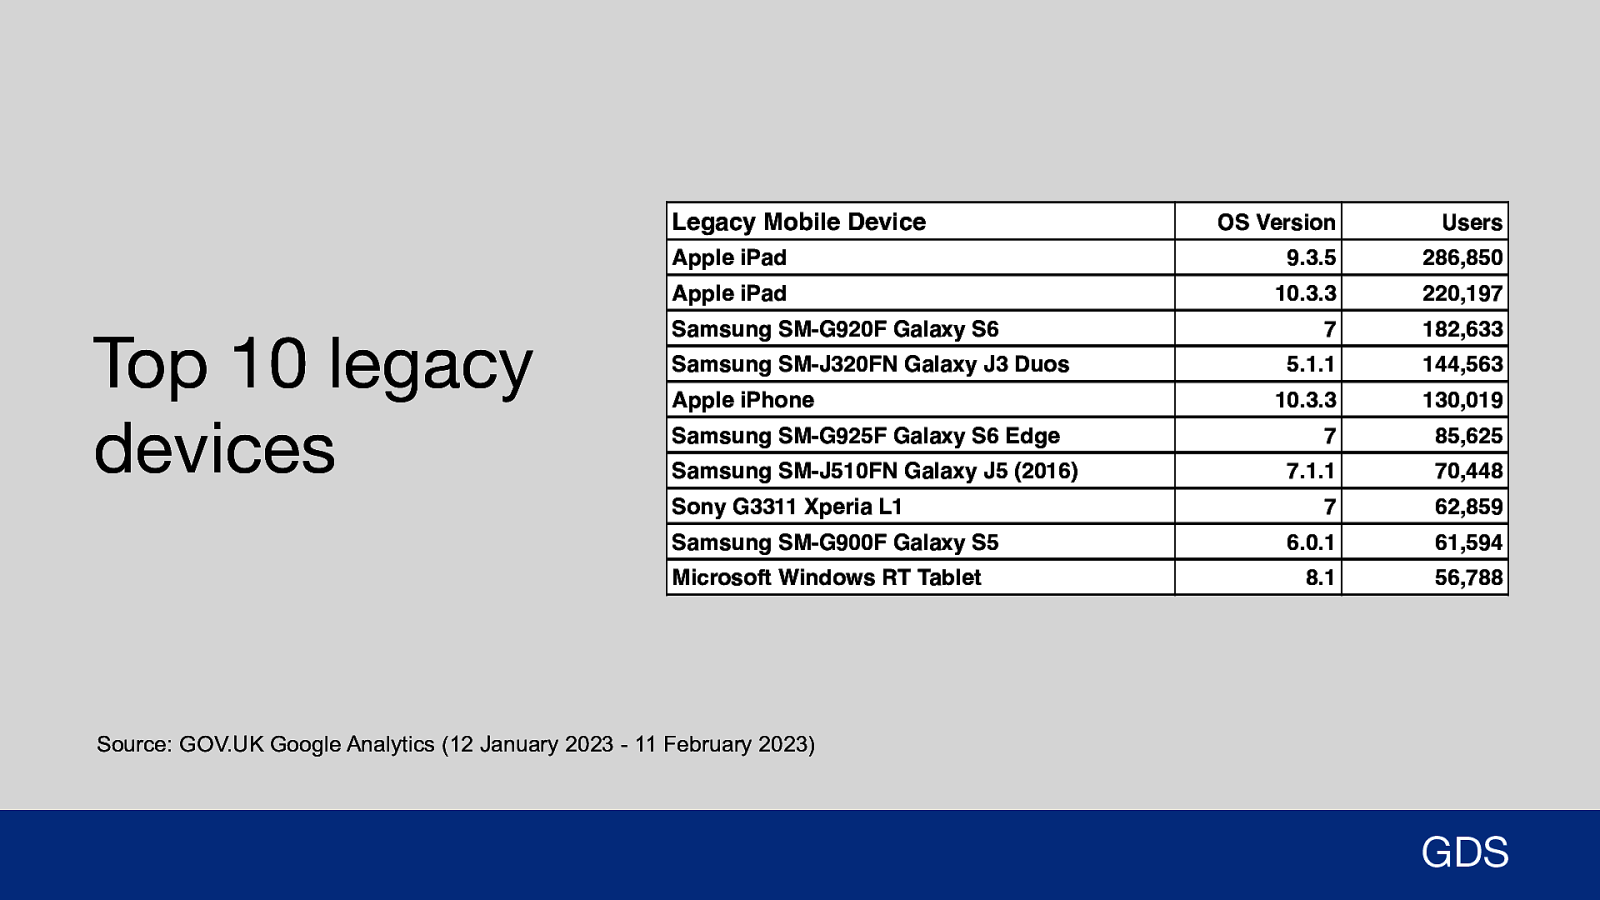
Legacy Mobile Device Top 10 legacy devices OS Version Users Apple iPad 9.3.5 286,850 Apple iPad 10.3.3 220,197 7 182,633 5.1.1 144,563 10.3.3 130,019 7 85,625 7.1.1 70,448 7 62,859 6.0.1 61,594 8.1 56,788 Samsung SM-G920F Galaxy S6 Samsung SM-J320FN Galaxy J3 Duos Apple iPhone Samsung SM-G925F Galaxy S6 Edge Samsung SM-J510FN Galaxy J5 (2016) Sony G3311 Xperia L1 Samsung SM-G900F Galaxy S5 Microsoft Windows RT Tablet Source: GOV.UK Google Analytics (12 January 2023 - 11 February 2023) GDS Here’s a list of the top 10 legacy devices users use on GOV.UK: 1. Apple iPads on iOS 9.3.5 are browser locked to Safari 9 = ~0.5% of traffic. 2. Apple iPhones on iOS 10.3.3 are browser locked to Safari 10. = ~0.4% of traffic 3. The Galaxy S6 is locked to Android 7. Samsung dropped all updates in April 2018 = ~0.3% of traffic
Slide 43
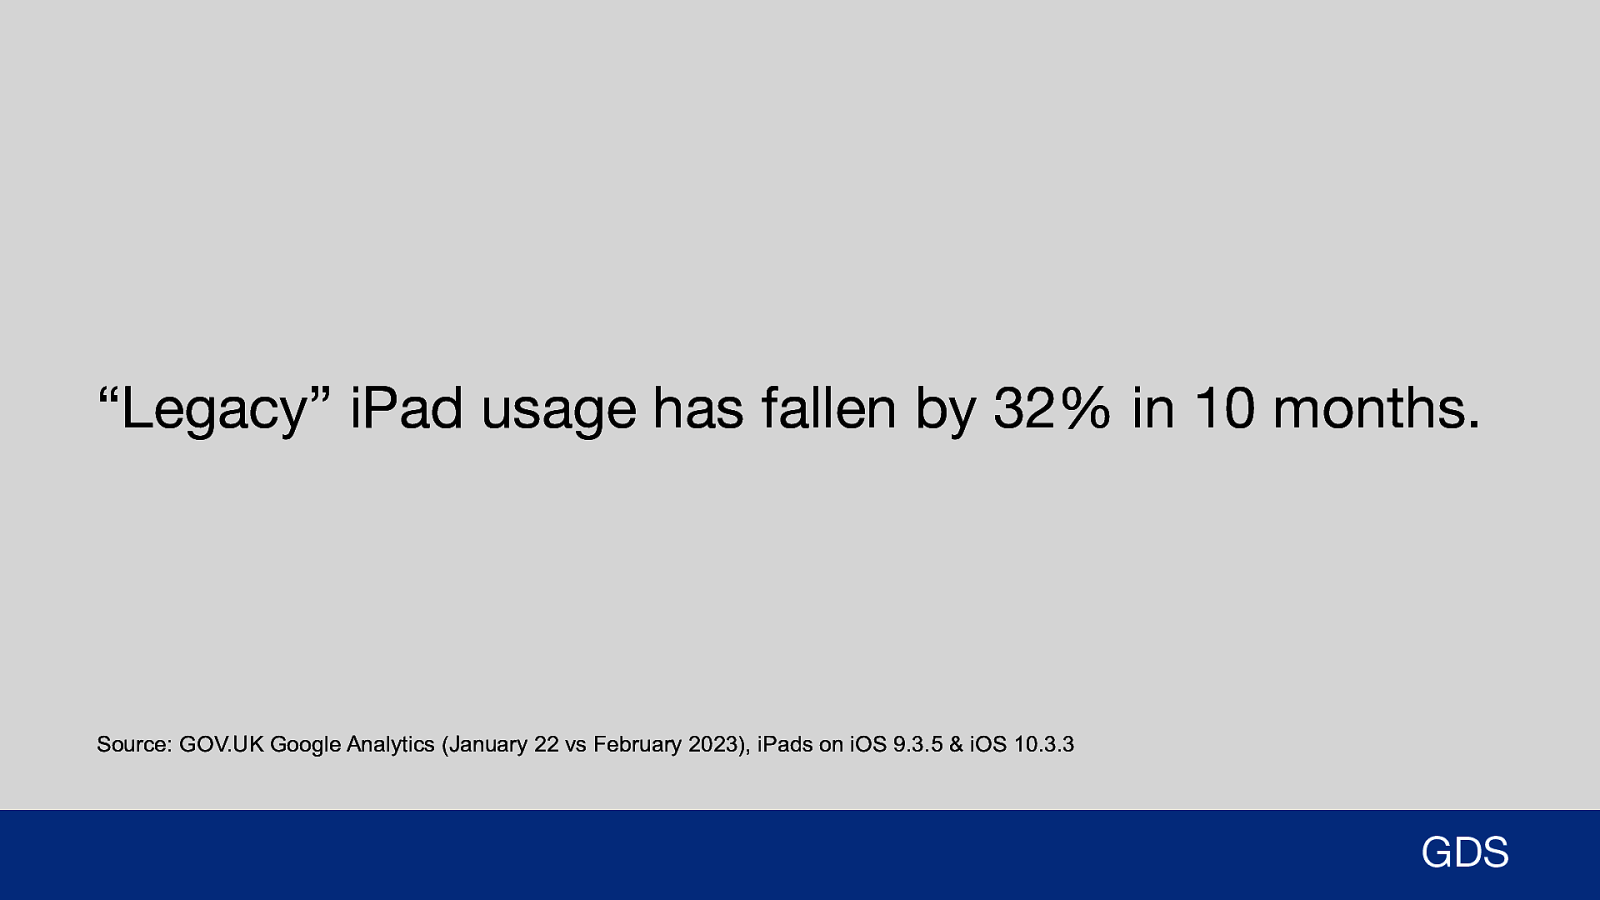
“Legacy” iPad usage has fallen by 32% in 10 months. Source: GOV.UK Google Analytics (January 22 vs February 2023), iPads on iOS 9.3.5 & iOS 10.3.3 GDS An interesting side note I noticed when updating the stats for this presentation. The use of older iPads has dropped by 32% in the last 10 months. I can’t be sure why this is, but I have 2 theories: 1. The performance of the web on these devices has reached a critical point where it is really starting to annoy users, so they may simply stop using it. 2. There’s now an affordable alternative on the market that people are upgrading too. Examining the second point: we’ve seen a 20% increase in the number of users on Microsoft tablets over the same period. For example, the Microsoft Surface Go costs between £400-£600…
Slide 44
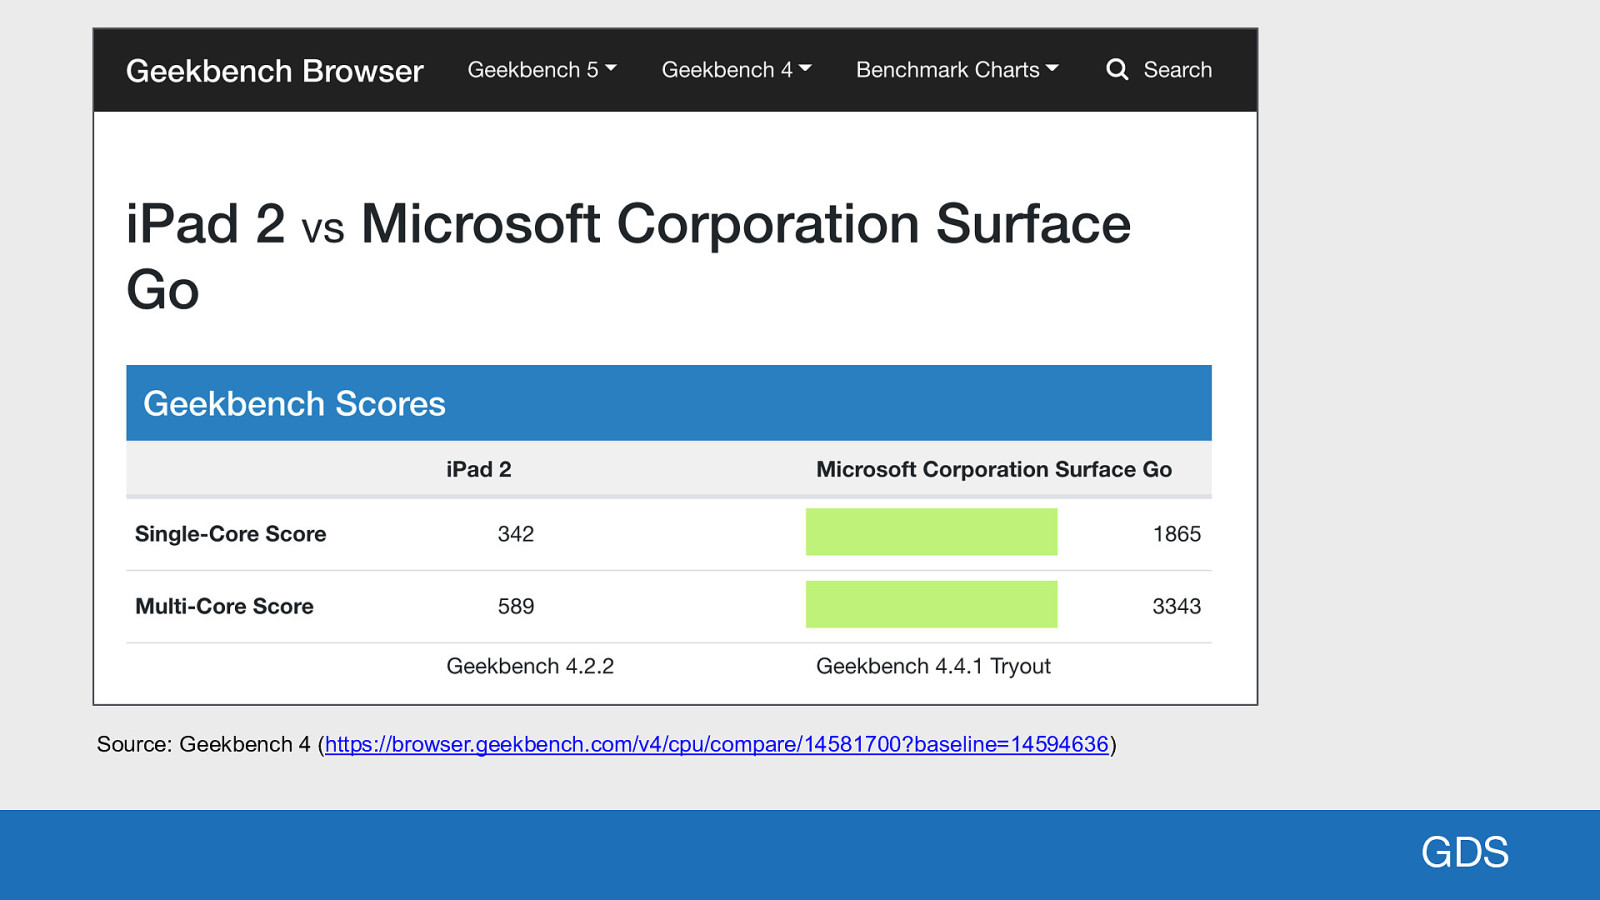
Source: Geekbench 4 (https://browser.geekbench.com/v4/cpu/compare/14581700?baseline=14594636) GDS .. and offers huge performance gains over the older iPads.
Slide 45
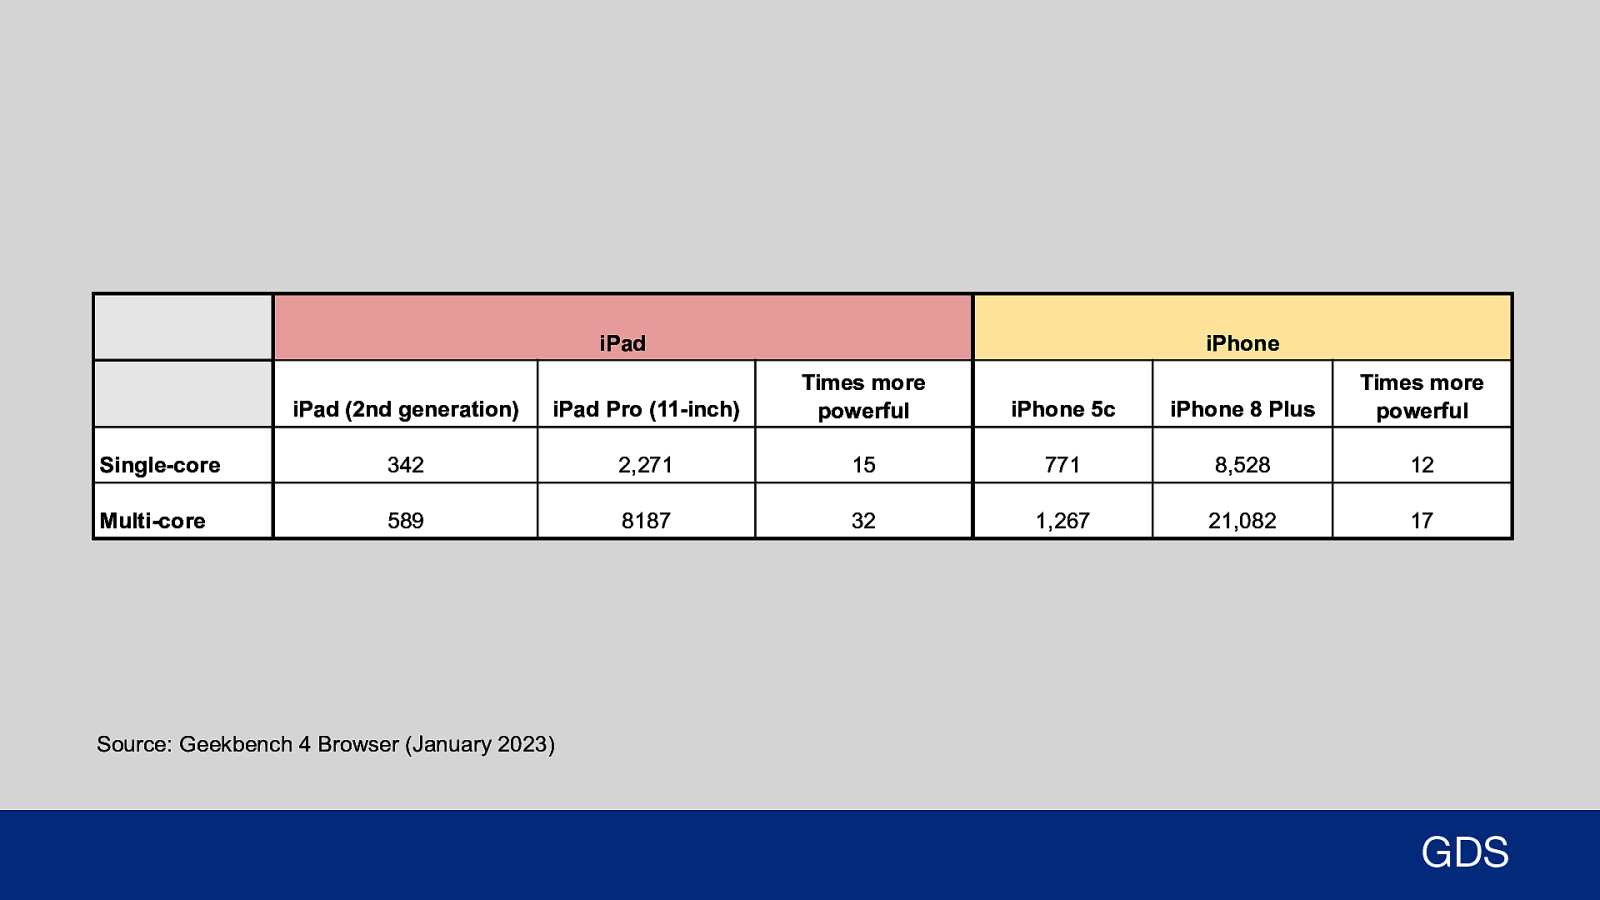
iPad iPhone iPad (2nd generation) iPad Pro (11-inch) Times more powerful iPhone 5c iPhone 8 Plus Times more powerful Single-core 342 2,271 15 771 8,528 12 Multi-core 589 8187 32 1,267 21,082 17 Source: Geekbench 4 Browser (January 2023) GDS So let’s examine the actual performance of these legacy devices against high-end versions available today using Geekbench 4: ● The iPad Pro 11-inch is 15 times more powerful than our top legacy iPad 2 on a single core, and 32 times more powerful when using multiple cores ● The iPhone 8 Plus is 12 times more powerful on a single core and 17 times more powerful when using multiple cores than our top legacy iPhone, the iPhone 5c Both these devices are used by approximately 0.5% of our users, or around a quarter of a million user visits each. That’s a lot of traffic! Being a government service, we can’t ignore those users.
Slide 46
“Modern” devices But you don’t only get poor performance on old devices. Devices being sold brand-new today frequently struggle with today’s web. These are usually low-cost, underpowered, Android devices.
Slide 47
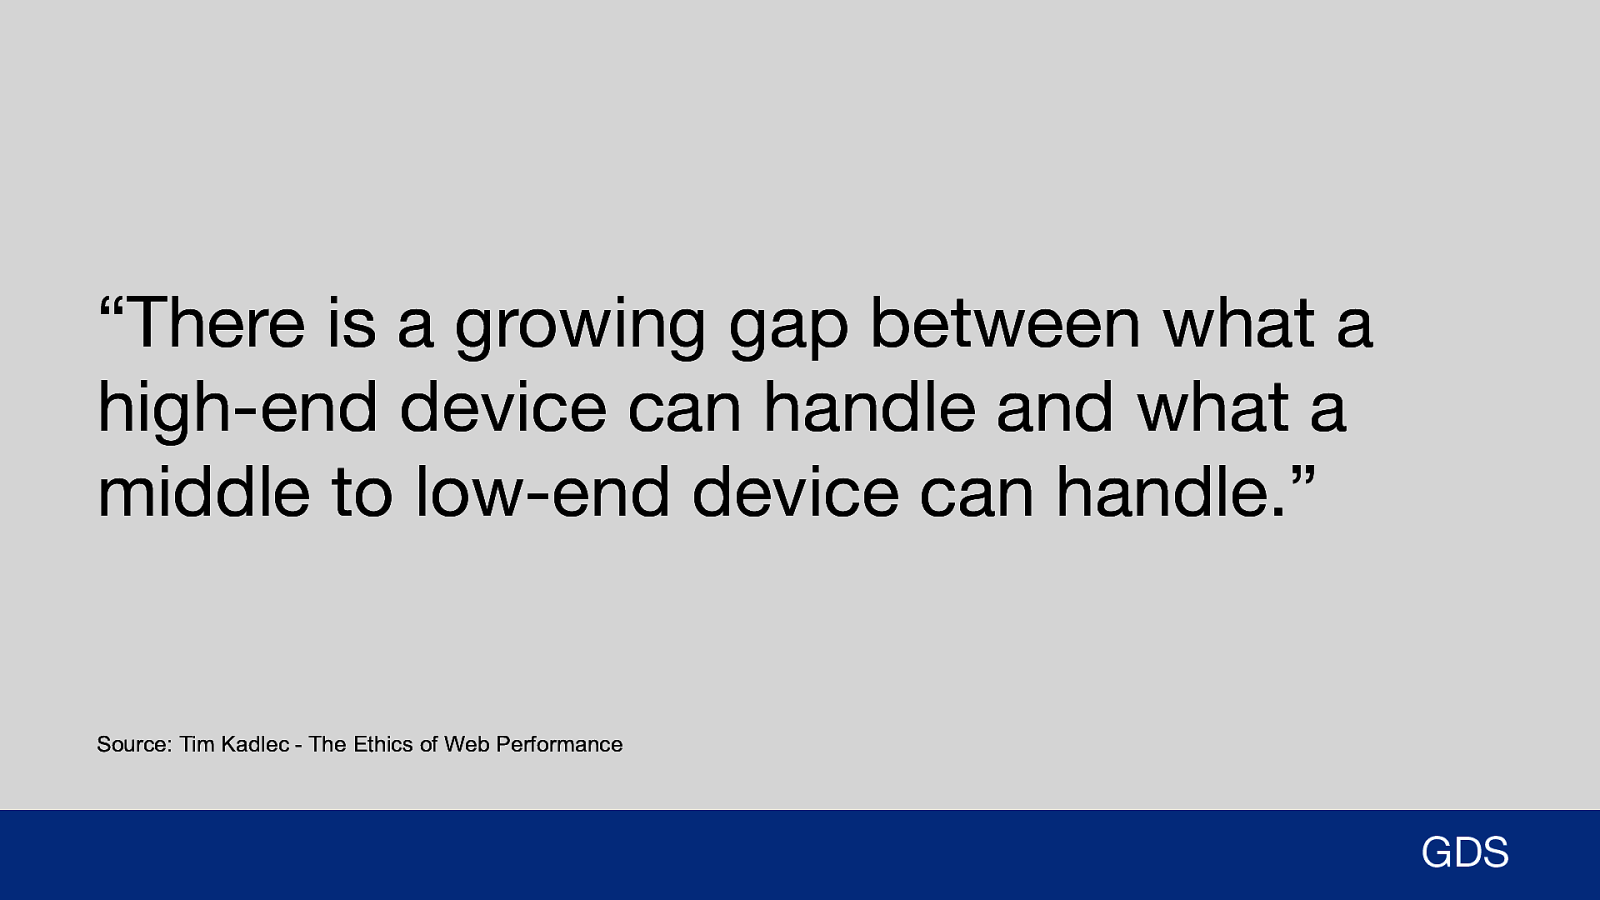
“There is a growing gap between what a high-end device can handle and what a middle to low-end device can handle.” Source: Tim Kadlec - The Ethics of Web Performance GDS Tim Kadlec, Web perf consultant in the US wrote a blog post the “Ethics of Web Performance” where he stated: “There is a growing gap between what a high-end device can handle and what a mid to low-end device can handle.”
Slide 48
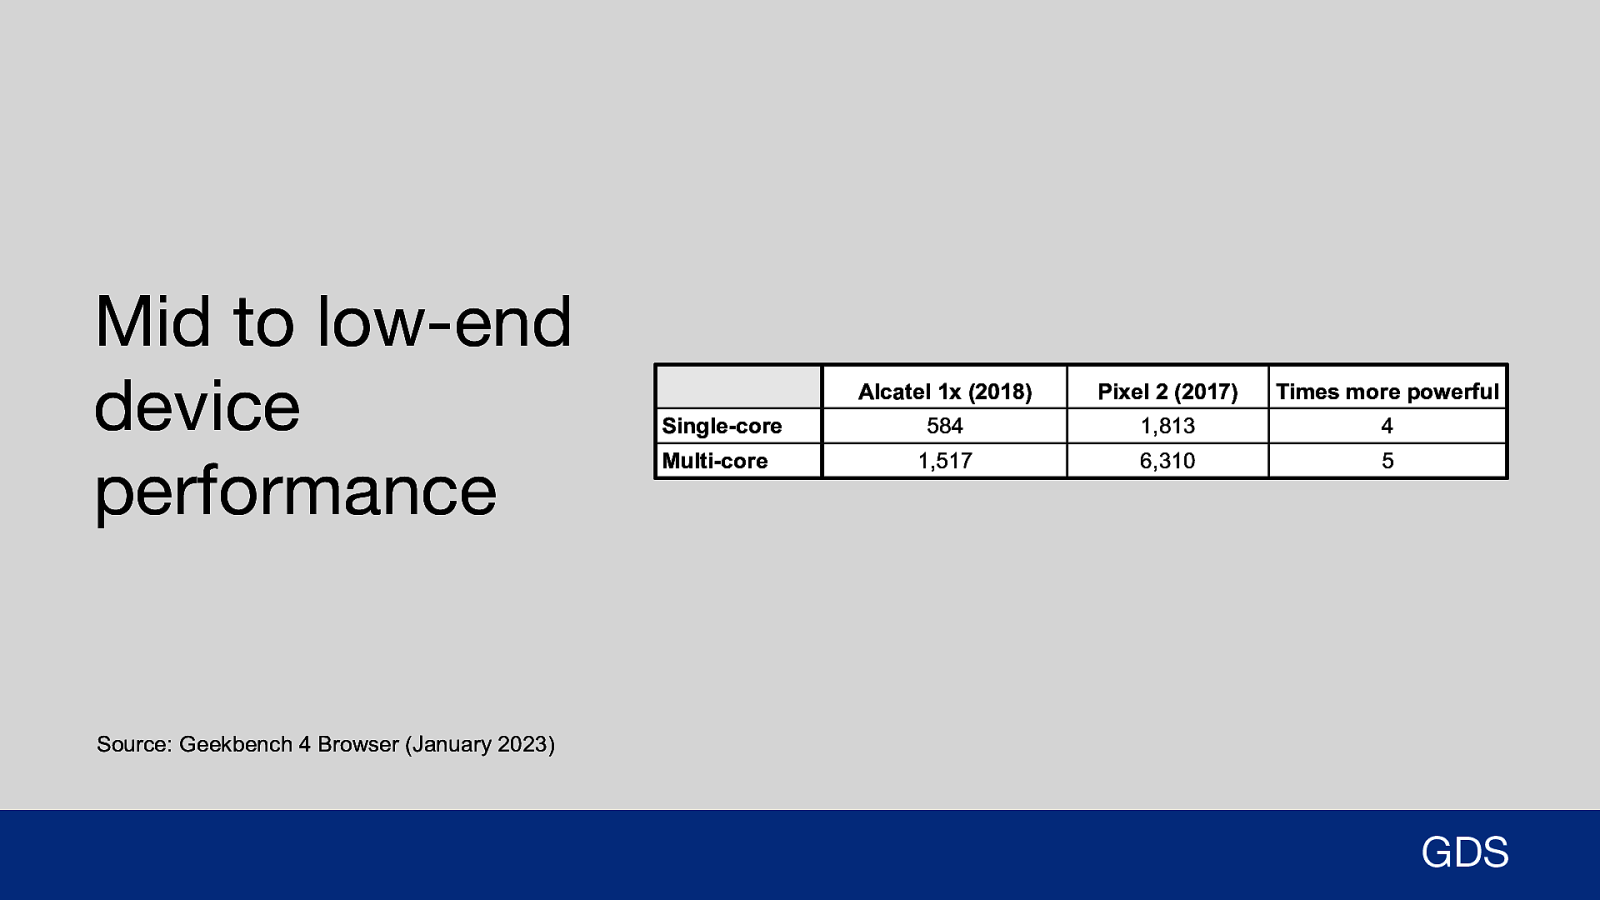
Mid to low-end device performance Single-core Multi-core Alcatel 1x (2018) Pixel 2 (2017) Times more powerful 584 1,813 4 1,517 6,310 5 Source: Geekbench 4 Browser (January 2023) GDS He tested 2 devices: ● Google Pixel 2 released in 2017, a high-end Android device ● Alcatel 1x released in 2018, budget Android device, still being sold today. The test page on the Pixel 2 loaded in 19 seconds. On the Alcatel 1x it took 65 seconds to load. That’s 242% slower for the exact same page. According to Geekbench, the high-end Pixel 2 is 5 times more powerful than the Alcatel 1x.
Slide 49

Identify and test on low spec devices GDS The key takeaway here is you should test on legacy and low-spec devices. By testing on low spec devices that you know your users actually use, you’ll be able to identify performance bottlenecks and prioritise them to be fixed. By fixing bottlenecks on low spec devices, you’re also improving web performance on all devices. As the saying goes “a rising tide lifts all boats”. All users will benefit from the improved performance.
Slide 50

User connections A big part of improving web performance is understanding what connection your users use? So let’s examine information we have about our users in the UK, as connection speeds vary massively.
Slide 51
UK average broadband speed in 2019: 22.37 Mbps Source: Worldwide broadband speed league 2019 GDS In 2019 the average broadband speed in the UK is ~22 Mbps.
Slide 52
‘Not-spots’ in London reported as low as 0.26 Mbps Source: London Digital Connectivity Report 2017 GDS But even in London, a city with global connections and infrastructure, there have been reports from users only getting speeds up to 0.26Mbps.
Slide 53
8% of indoor spaces in the UK have no mobile data coverage Source: Ofcom Connected Nations Report - January 2019 GDS So if you have a poor broadband connection, can you rely on mobile data? Unfortunately not. An Ofcom report from 2019 found that 8% of indoor spaces in the UK have no mobile data coverage. The first 5G service was released in the UK in May of 2019. The comments from the BBC News article at that time made for an interesting read:
Slide 54
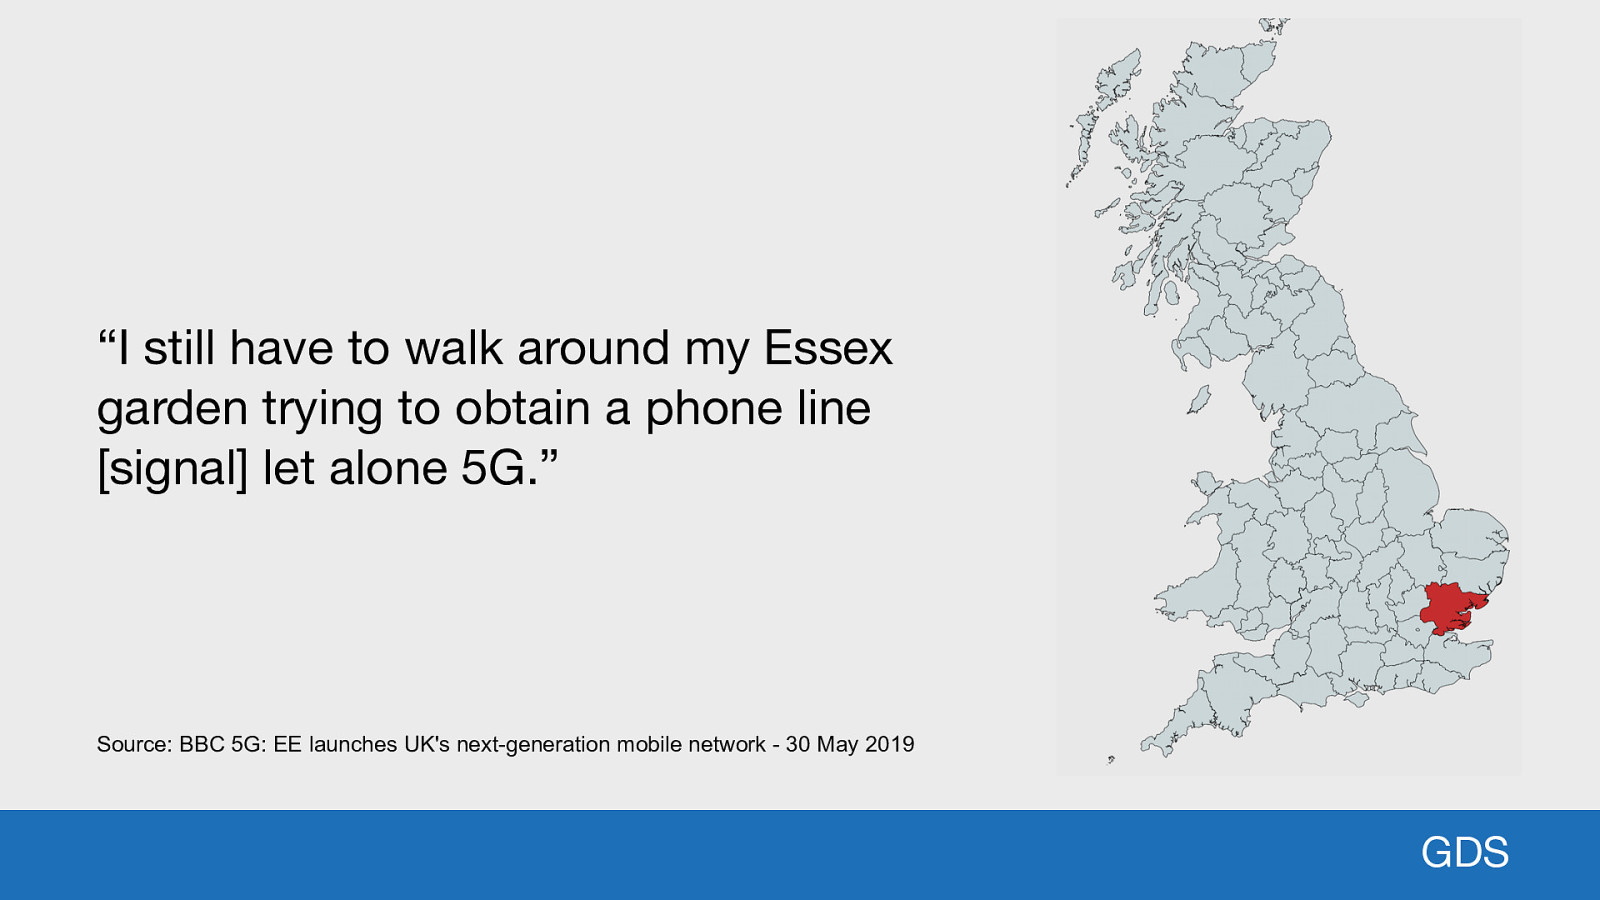
“I still have to walk around my Essex garden trying to obtain a phone line [signal] let alone 5G.” Source: BBC 5G: EE launches UK’s next-generation mobile network - 30 May 2019 GDS Getting a phone signal in parts of Essex can be a problem…
Slide 55
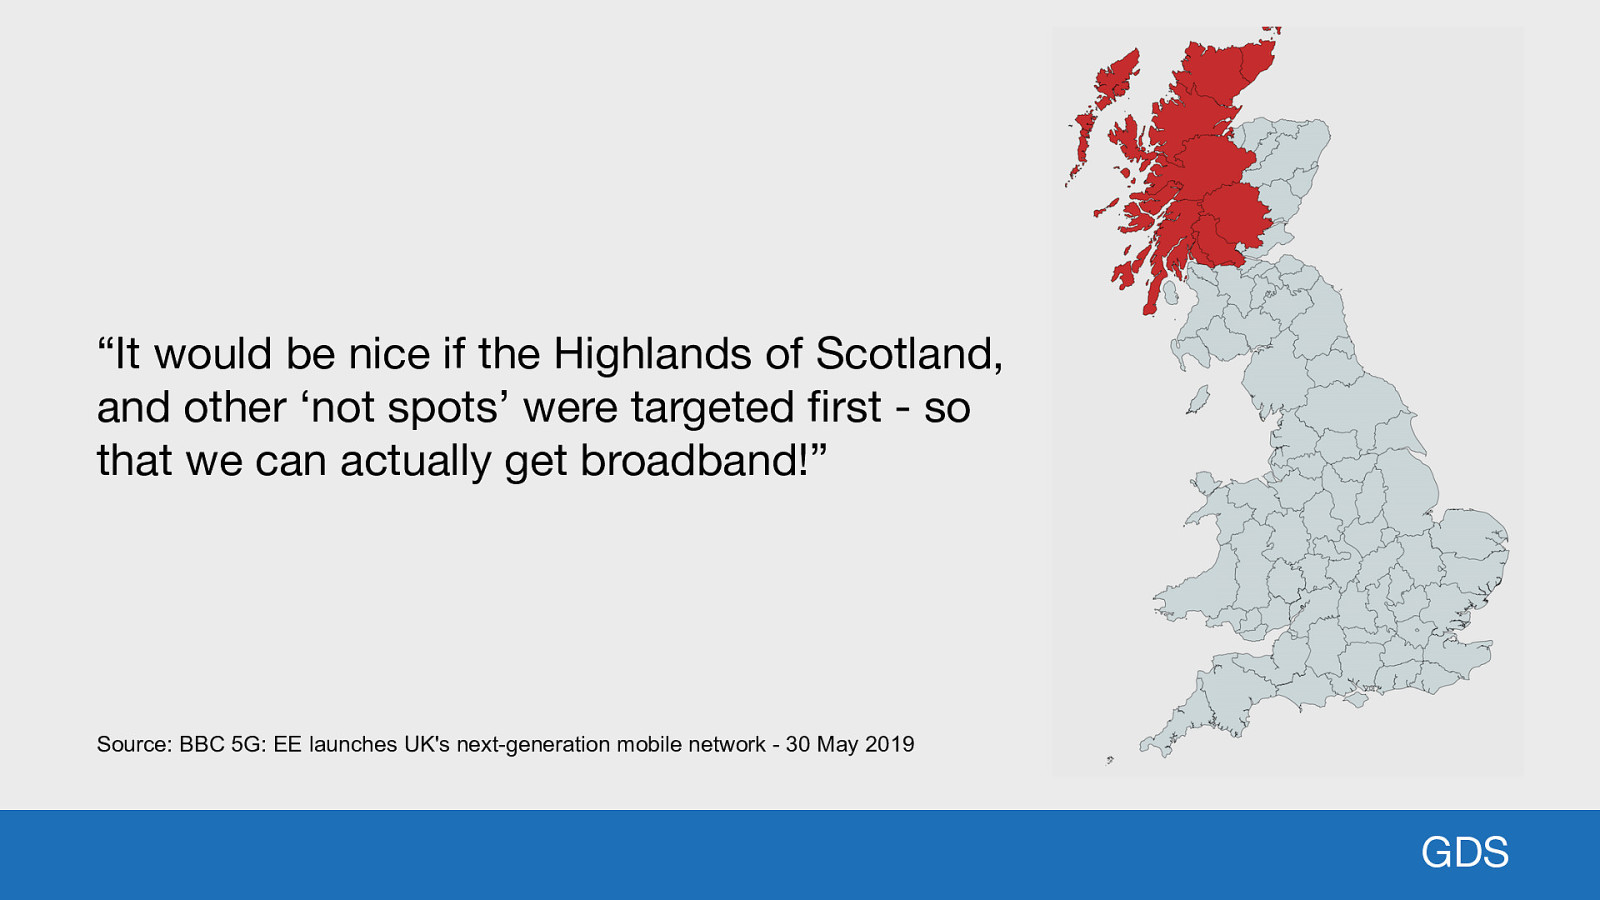
“It would be nice if the Highlands of Scotland, and other ‘not spots’ were targeted first - so that we can actually get broadband!” Source: BBC 5G: EE launches UK’s next-generation mobile network - 30 May 2019 GDS And some parts of Scotland are still waiting for broadband!
Slide 56
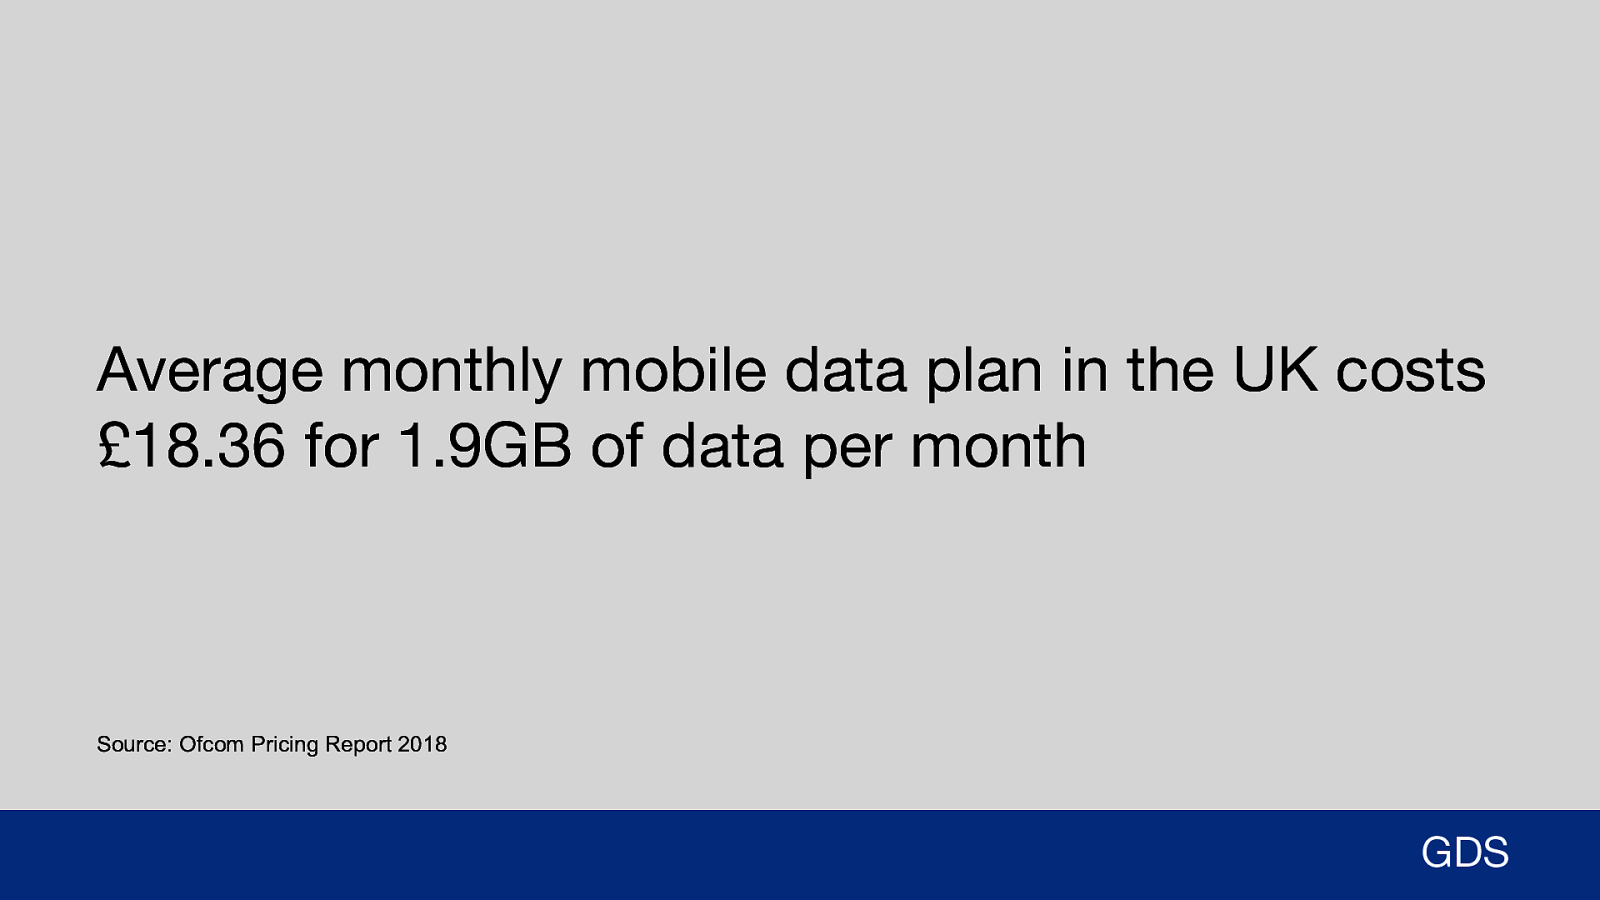
Average monthly mobile data plan in the UK costs £18.36 for 1.9GB of data per month Source: Ofcom Pricing Report 2018 GDS And even if you could rely on mobile data, would you want to? Mobile data is expensive and often very limited. The average monthly plan in the UK costs £18.36 for just under 2GB of data.
Slide 57
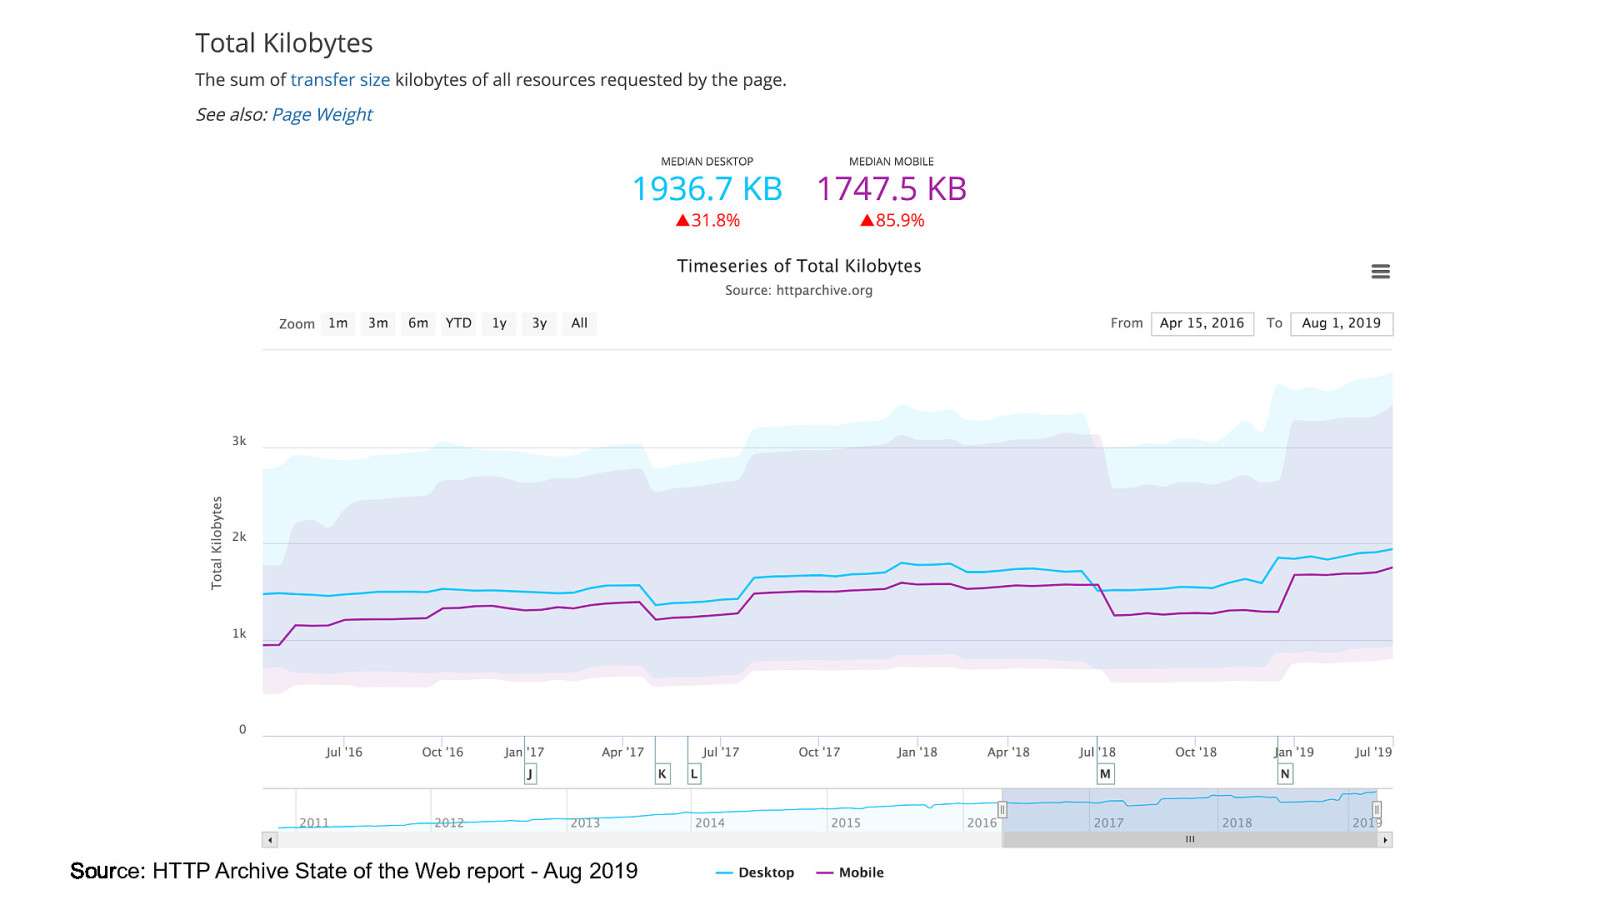
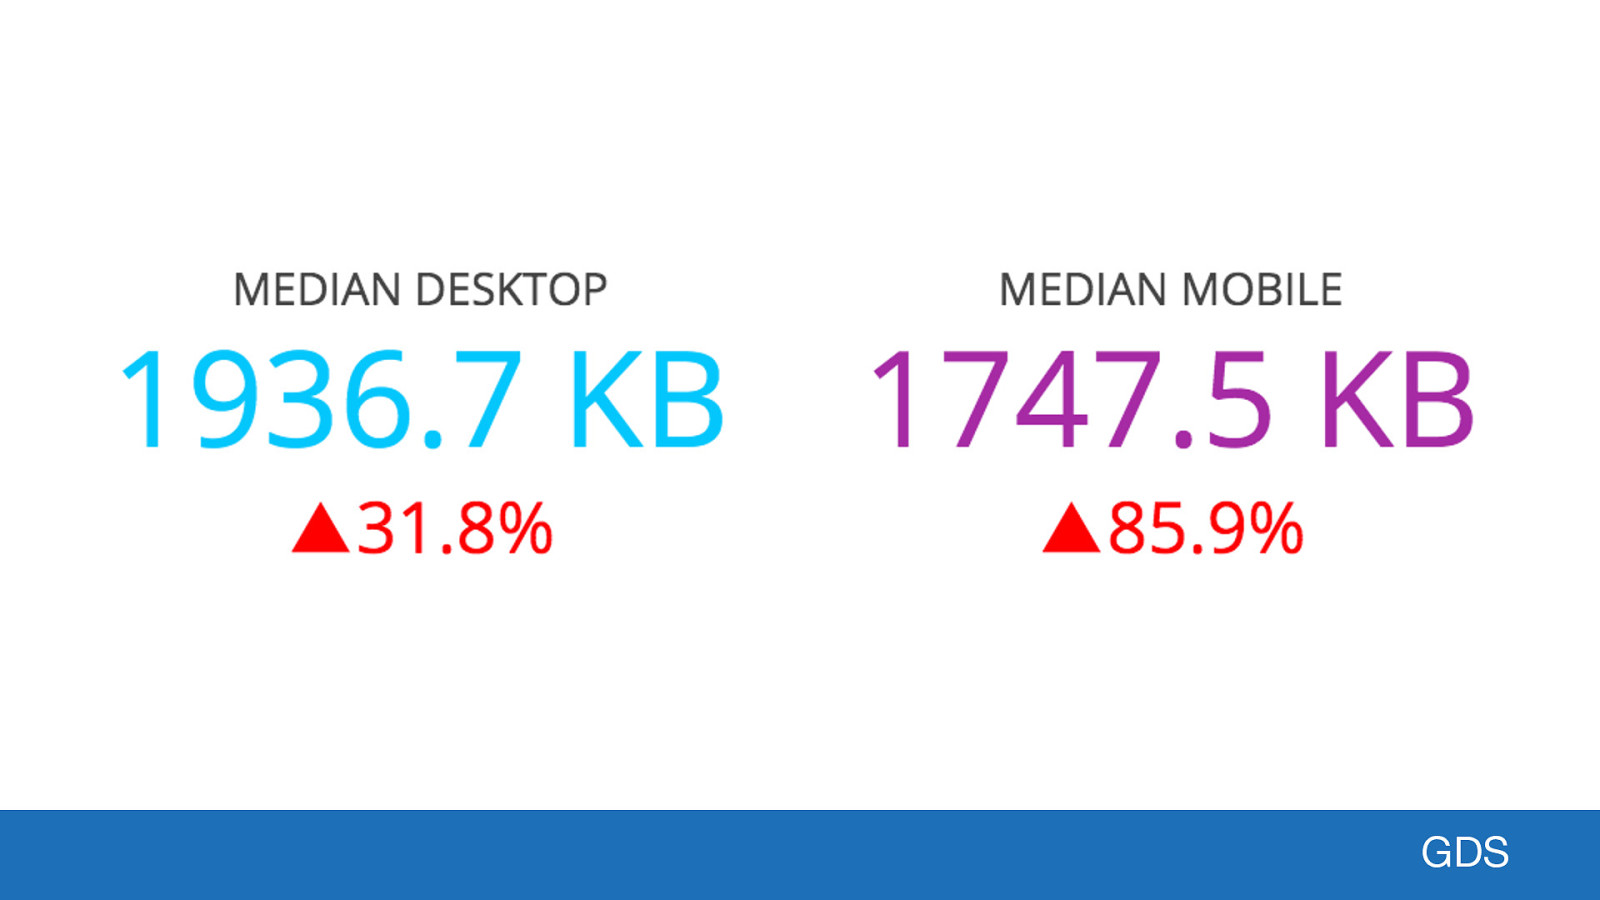
Source: HTTP Archive State of the Web report - Aug 2019 Considering the median desktop page weight on the web today is 1.9MB, and almost 1.8MB for mobile, that 1.9GB doesn’t stretch far over a month.
Slide 58
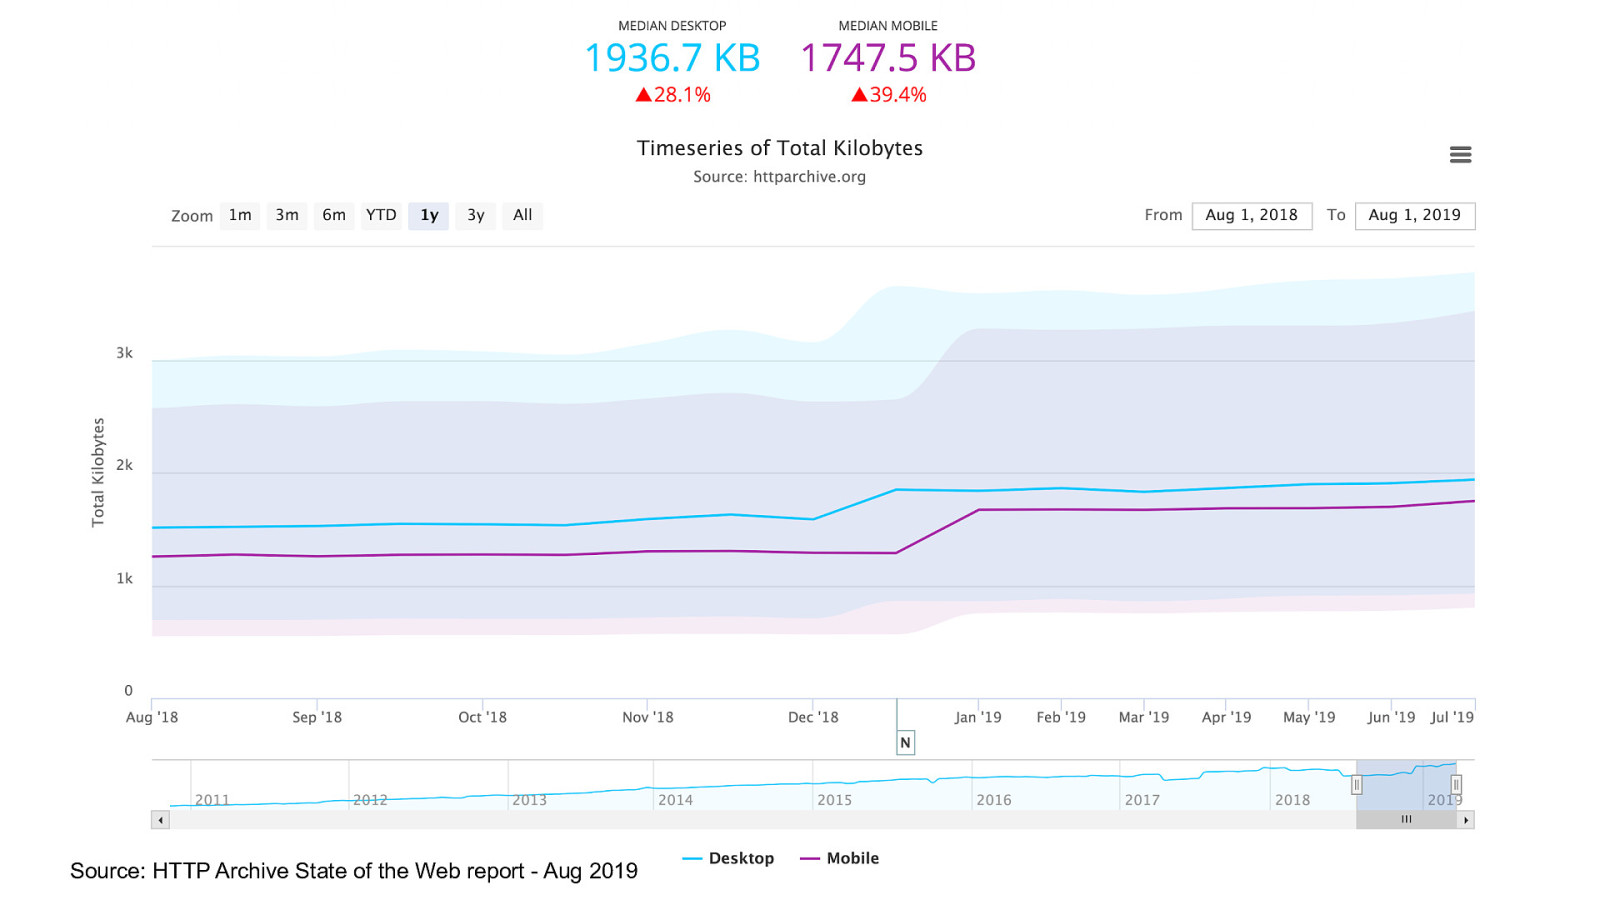
Source: HTTP Archive State of the Web report - Aug 2019 If we focus only on the past 12 months, median desktop page weight has increased by 28%, median mobile page weight by almost 40%! Those are huge percentages for a single year.
Slide 59
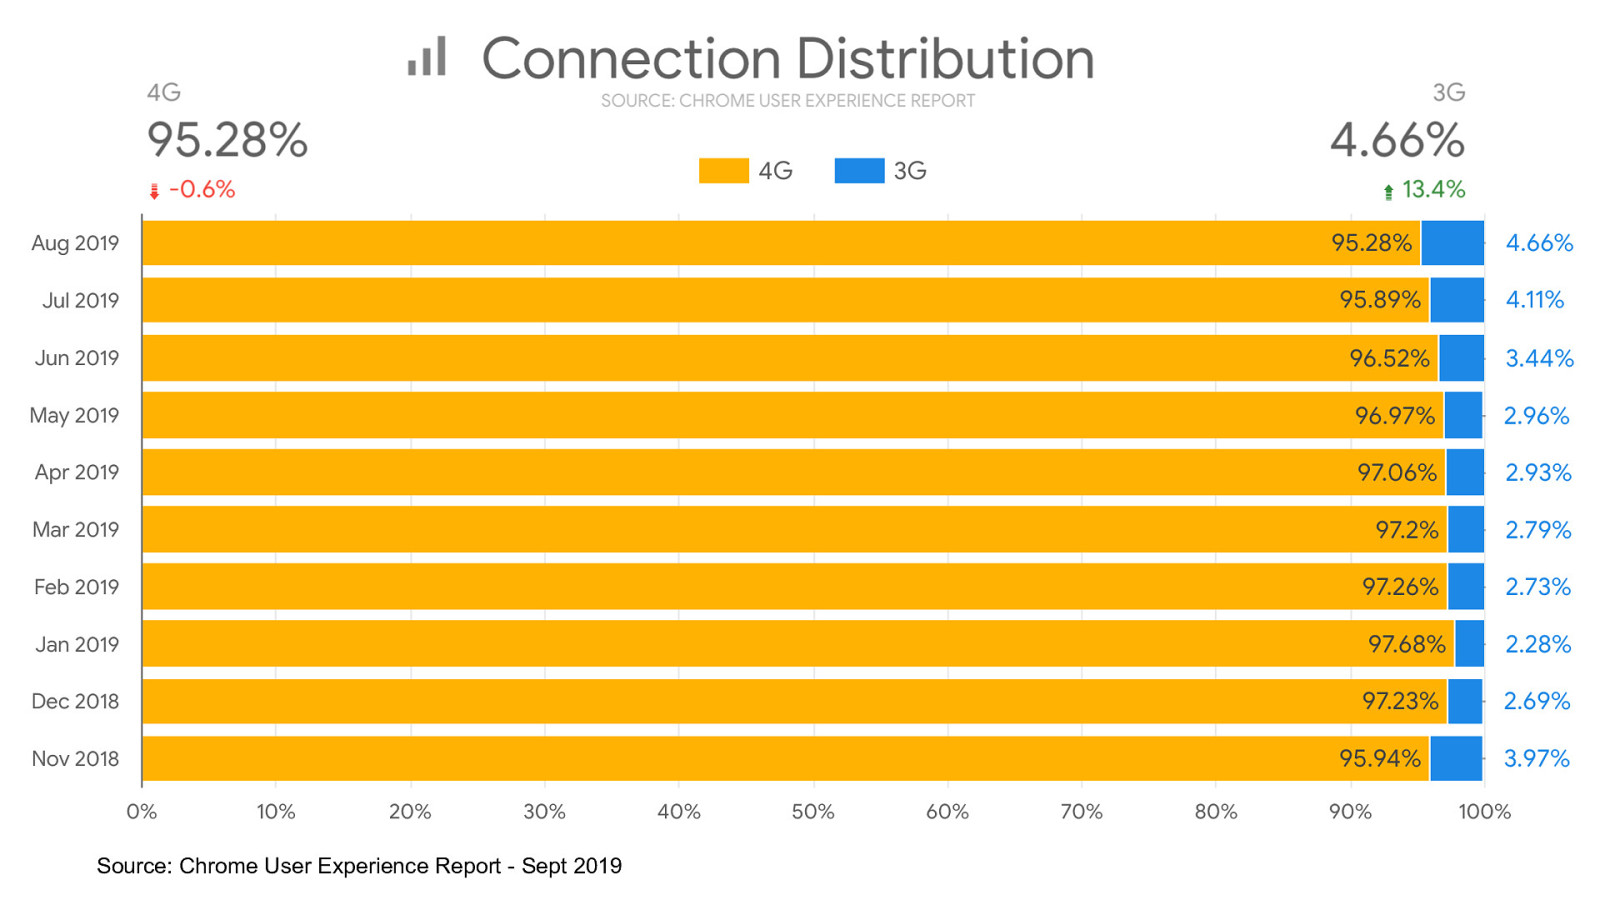
Source: Chrome User Experience Report - Sept 2019 Looking at data from GOV.UK, the majority of our users are on a connection speed that is 4G or greater. 3G seems to be gradually increasing which is unusual. I’m still trying to identify why that is (any theories, let me know!). I’ve omitted 2G from the graph since it is at 0% for all months. To be clear, there are 2G users, but due to the way this data is collected and categorised they are all being bumped up into the 3G bracket. All things considered, due to the fairly high, and increasing percentage of users on a 3G connection speed, this is one we are actively testing on.
Slide 60
Test websites on poor connections GDS So one task to add to your web performance checklist: Make sure you test a websites performance on slow connections. ● You can do this via the browser developer tools OR ● If you know somewhere that has a slow connection, try it in person on a real device. Many of your users don’t have the option of a faster connection. If your website size is gradually increasing over time, these users will struggle. So optimise for the connections that they have.
Slide 61

User stress One of the major impacts of poor web performance on a user is stress. I’m sure we’ve all been in this situation. You’re purchasing something on an e-commerce website, you’ve entered all your card details, you’ve submitted the form and are waiting for the confirmation. It’s taking a while, so long in fact it eventually times out. Poor web performance has turned this routine purchase into a stressful experience. You’re left asking the question: ● ● ● ● Did the order go through? Did I actually pay for it? Should I reload and try again? Do I need to check my bank account to confirm?
Slide 62
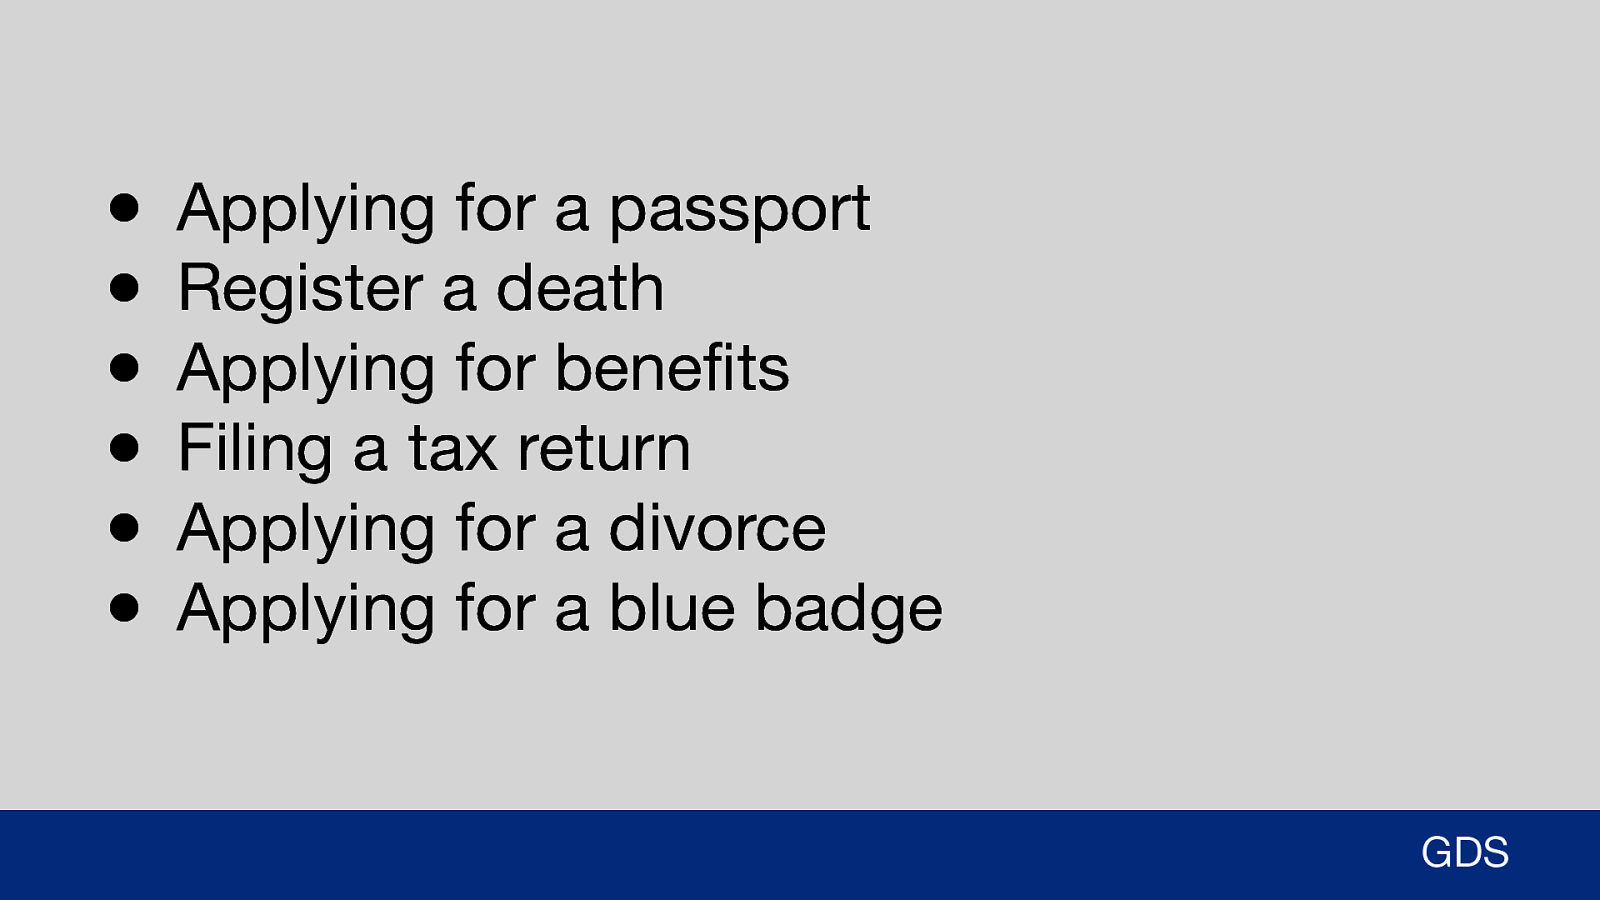
● ● ● ● ● ● Applying for a passport Register a death Applying for benefits Filing a tax return Applying for a divorce Applying for a blue badge GDS We don’t have much in terms of e-commerce in government, but what we do have is a whole selection of forms that can have real-world implications to users if incorrectly completed, or not completed at all. Forms like: ● Applying for a passport ● Register a death ● Applying for a blue badge
Slide 63
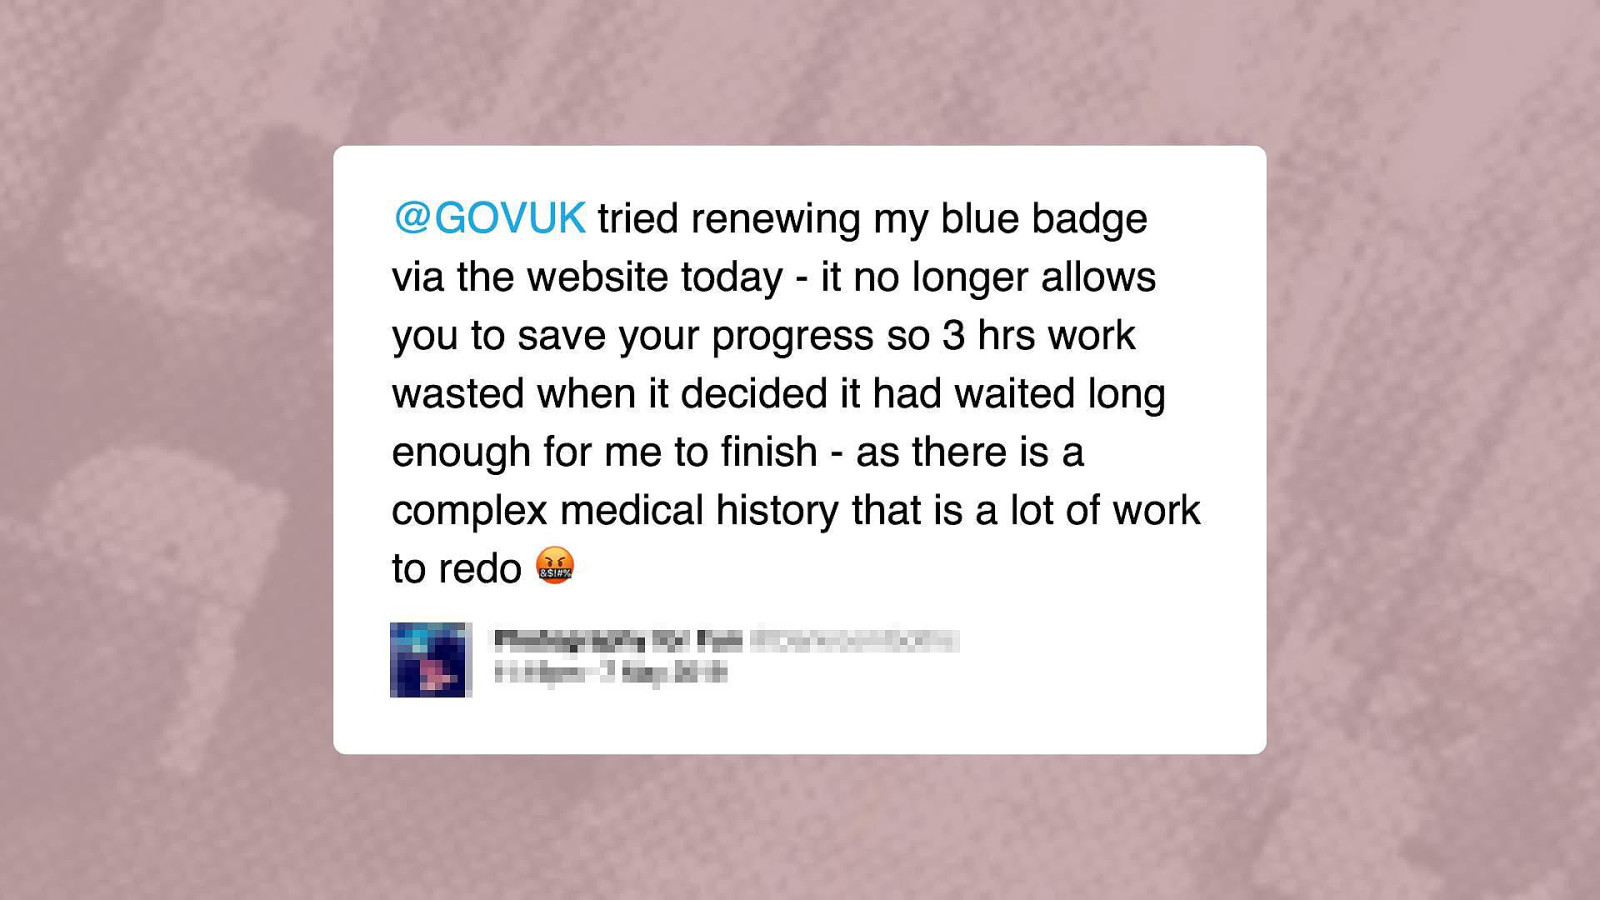
Here’s an example tweet from a user: Summary: ● User applying for a blue badge ● No save progress function on the form ● Page timed out, 3 hours wasted Although this isn’t directly linked to web performance, it does give you an idea of how much work users may need to do to complete some government forms.
Slide 64
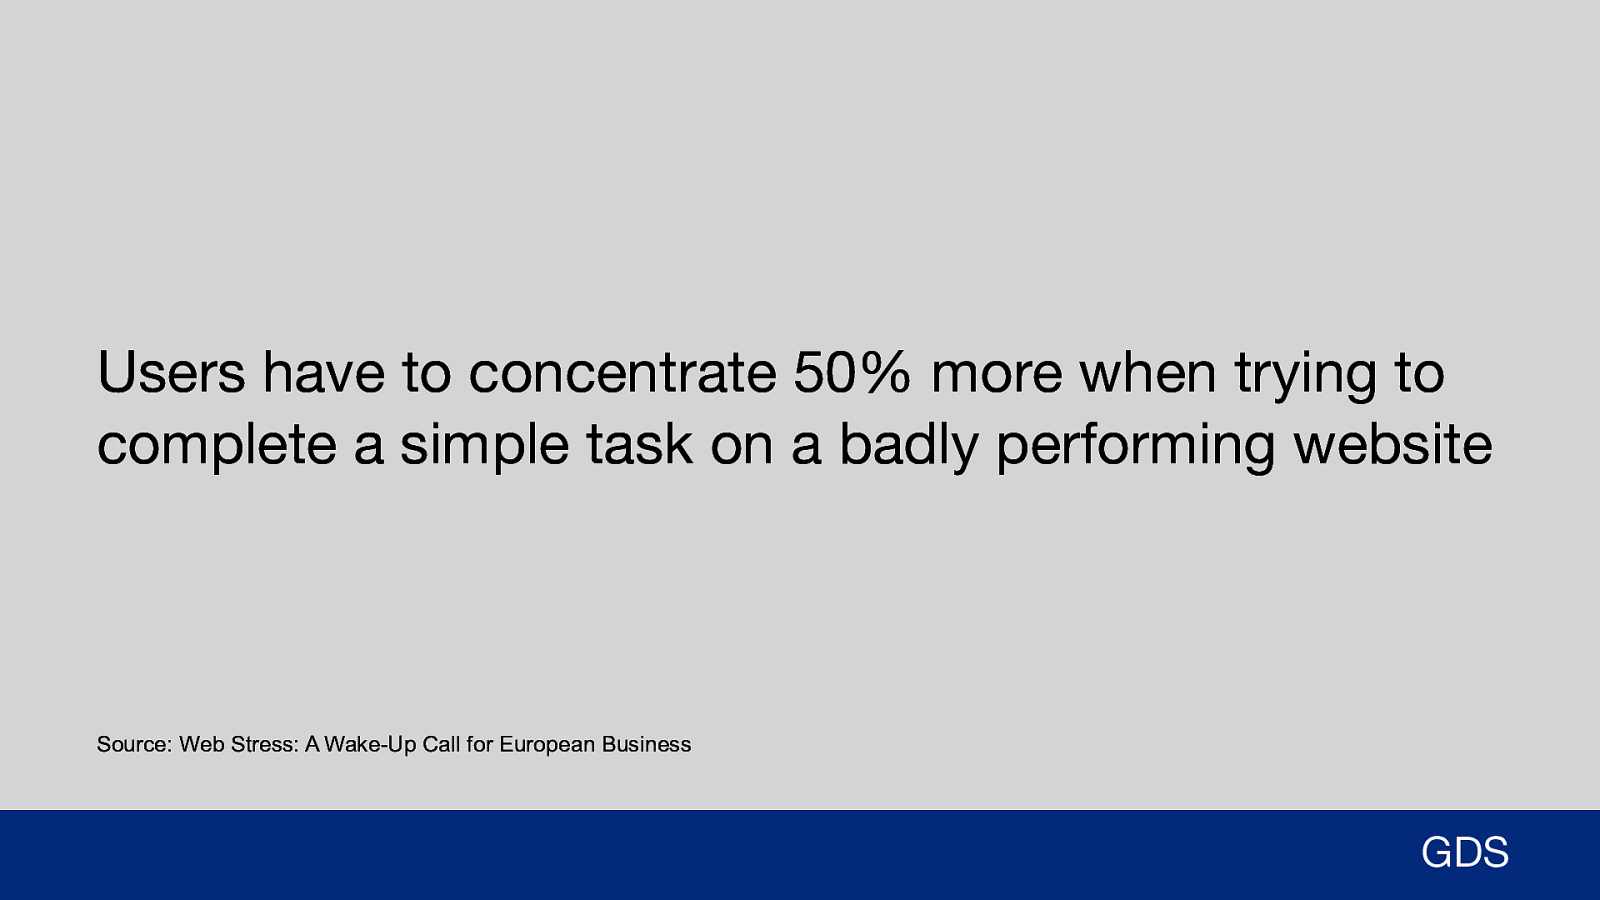
Users have to concentrate 50% more when trying to complete a simple task on a badly performing website Source: Web Stress: A Wake-Up Call for European Business GDS Research from Glasgow Caledonian University found participants had to concentrate 50% more when trying to complete a simple task on a badly performing website. So imagine what happens with a complex task. The last thing a user needs when completing an already stressful form, is a poor performing website. Poor performance stresses users out. A stressed user will get annoyed and may just give up the task completely, leading to high drop-out rates. Unsure if using your website is stressful? Do some user testing with users under real conditions.
Slide 65
Sustainability Another important aspect for web performance in government services (and indeed everyone else) is sustainability. The tech stack that is used to host these services doesn’t come for free.
Slide 66
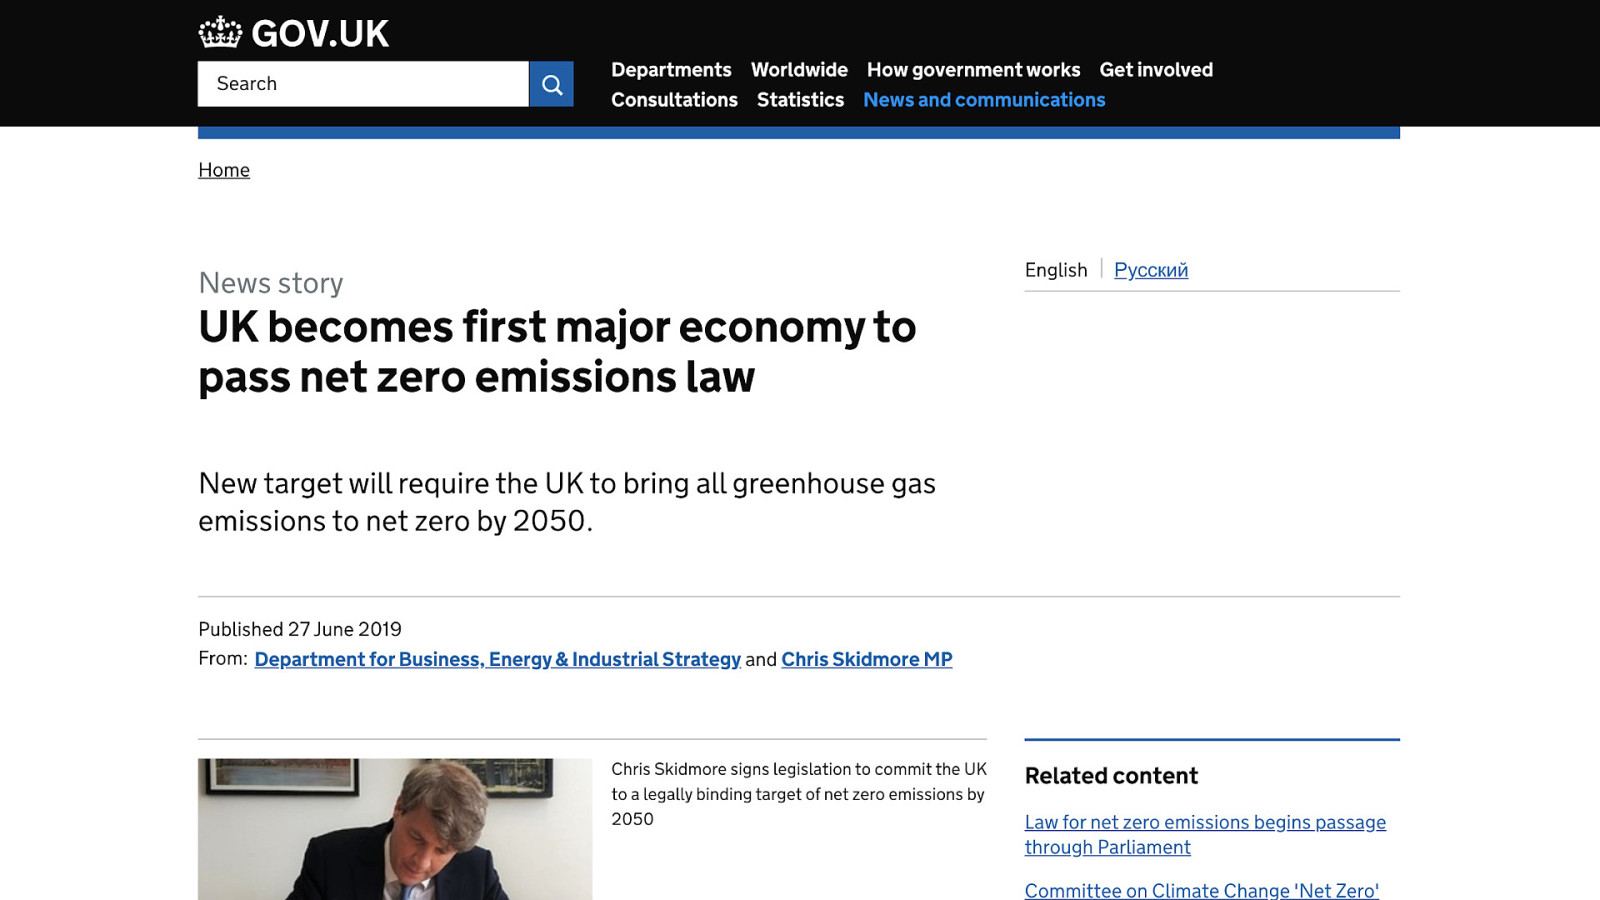
As a nation, we’ve committed to reducing emissions to zero by 2050.
Slide 67
“We will need to be sure that we are using clean and green digital and technology services and practices” Source: The Greening Government Sustainable Technology Strategy 2016-2020 GDS As a department, we have “Greening Government” commitments that mean we have to measure and reduce the emissions caused by our work. In particular, the Sustainable ICT strategy means we have to choose “clean and green digital and technology services and practices” for all aspects of our work. ICT = information and communications technology
Slide 68
“ICT currently accounts for around 3.6% of global electricity use and 1.4% of greenhouse gas emissions” Source: The Energy and Carbon Footprint of the Global ICT and E&M Sectors 2010–2015, Malmodin and Lunden GDS Information and Communications Technology currently accounts for 3.6% of global electricity use, and 1.4% of greenhouse gas emissions. It may seem obvious, but services like GOV.UK keep running thanks to computers in data centres. We might call this “The Cloud”, but it’s a material thing.
Slide 69
GDS estimates running all our services produce up to 4,000 tonnes of CO2 a year Source: GDS Sustainability Network - https://gds.blog.gov.uk/2019/10/03/measuring-the-climate-impact-of-our-digital-services-at-gds/ GDS The GDS Sustainability Network recently estimated that running our digital services produces up to 4,000 tonnes of CO2 a year.
Slide 70
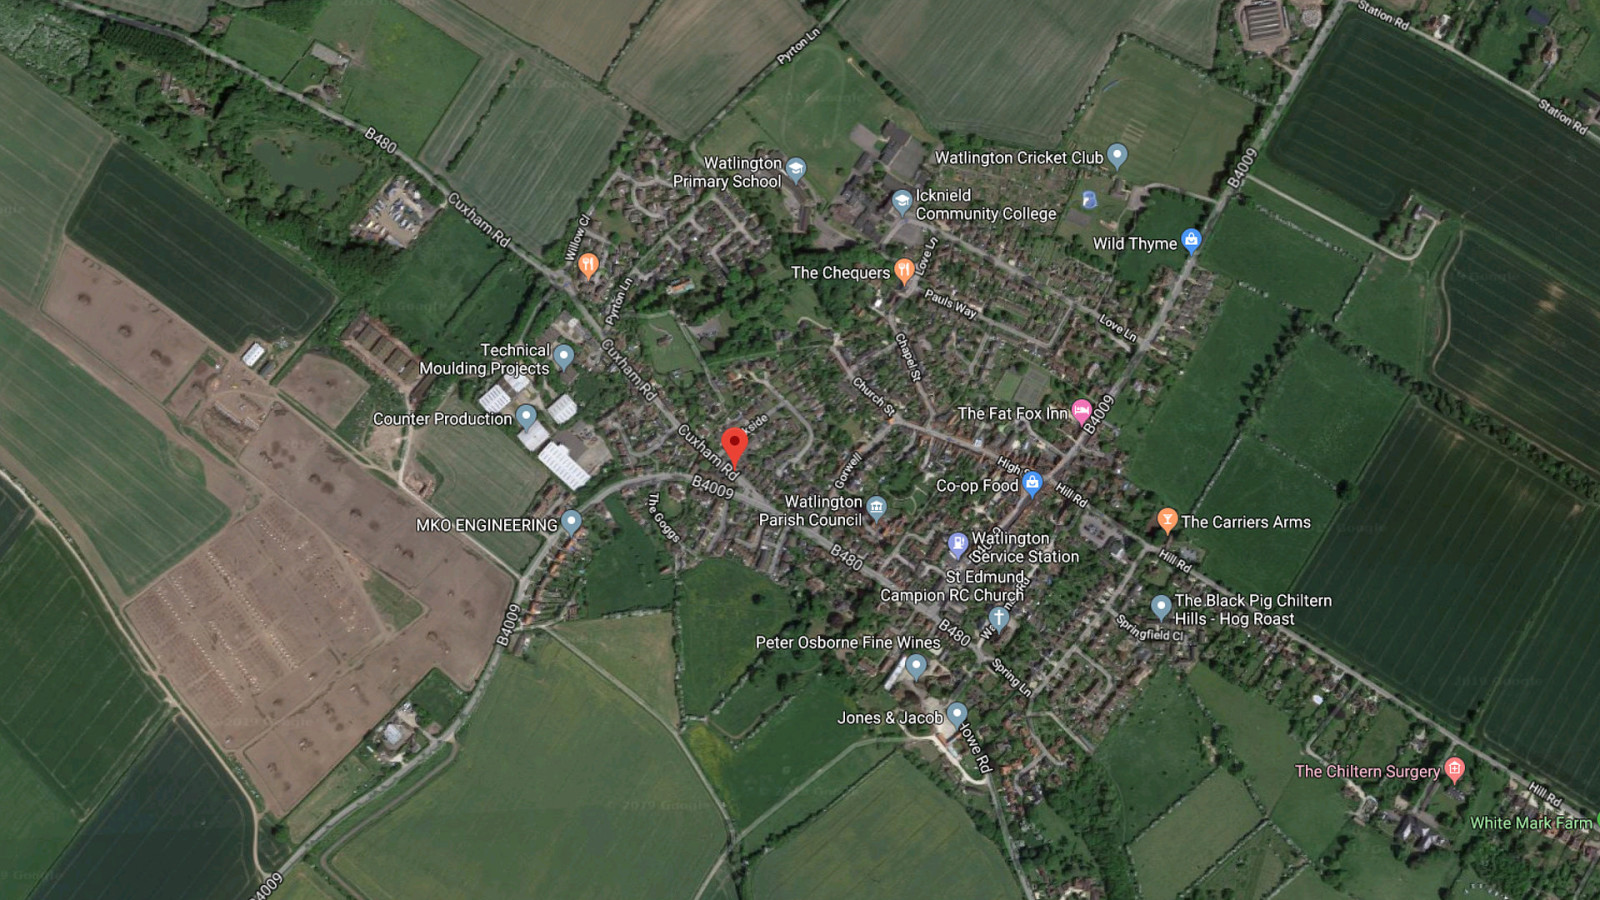
That’s as much as a village with over 450 households, heating and powering their homes for a year. Like this village called Watlington in the Cotswolds, Oxfordshire. Lovely little village, highly recommend visiting if you are in the area.
Slide 71
● ● ● ● Larger assets = more hosting required More hosting = more computing power required More computing = more electricity required More electricity = more CO2 GDS Some of you may be asking “Well what has this got to do with web performance?” Well quite a lot actually: ● As mentioned before hosting uses a lot of electricity in terms of the raw computing power, but also the fact that these data centres require huge amounts of cooling. ● Electricity generation for both of these often produces CO2. ● The larger your assets, the more hosting is required and therefore the more electricity used. But what’s worse is every user visiting the site needs to download more, and therefore needs to process more on their device(s). The more processing required, equals more battery usage. More battery usage equals more electricity used to power these devices. Looking at GOV.UK, if you have millions of people all using more electricity than they need too, that adds up to a lot of CO2 savings that can be made simply by optimising web performance.
Slide 72

The WWW is the greatest infrastructure mankind has ever created, but it comes at a cost GDS Looking at the web and web performance at a very high level, the world wide web is the greatest infrastructure mankind has ever created, but it comes with a cost that can be physically measured in the real world.
Slide 73

#webperf matters So what happens if a government service performs badly?
Slide 74
Users on poor connections and older devices are excluded GDS As the user stories and connection information showed, poor web performance negatively affects users, ultimately leading to exclusion.
Slide 75
Users can’t get the information and guidance they need GDS In government, if a user can’t get the information and guidance they need, where can they go? There are no competitors a user can use to get this information. If the website is performing poorly, a user will need to find a different government channel, like email or phone enquiries. These channels are expensive to run, and ultimately cost the taxpayer more money. There’s also risk that some users will be driven to sites that charge for information and services that the government provide for free. These business are essentially copying government guidance, filling in a form and adding a huge markup for the privilege.
Slide 76

Policy? What about policy? Is there a government policy in place to enforce web performance? I’m afraid not.
Slide 77
EU Directive on the accessibility of public sector websites and mobile applications. GDS For accessibility, there’s an EU directive we follow. We have a legal obligation to do so.
Slide 78
Moral obligation to make sure our websites perform well on as many user devices as possible GDS But although we don’t have a legal obligation around web performance, I believe we do have a moral obligation to make sure our websites perform well for all users. The reason being? Well simply because it is the right thing to do. No user should be excluded from a government service. Anyone who needs it should be able to access it.
Slide 79

Always improving So what are we doing at GDS to optimise frontend web performance? Here a just a few things we have implemented or are investigating:
Slide 80

HTTP/2 GDS HTTP/2 (h2) is a new revision of the HTTP protocol. It was standardised in 2015 and is supported by 95% of browsers used by users today. One of the main goals of h2 is to improve page loading speed by fixing known performance issues in HTTP/1.1. In October 2018 we trialled the use of h2 on GOV.UK for 4 weeks to test see if it improved performance for our users.
Slide 81
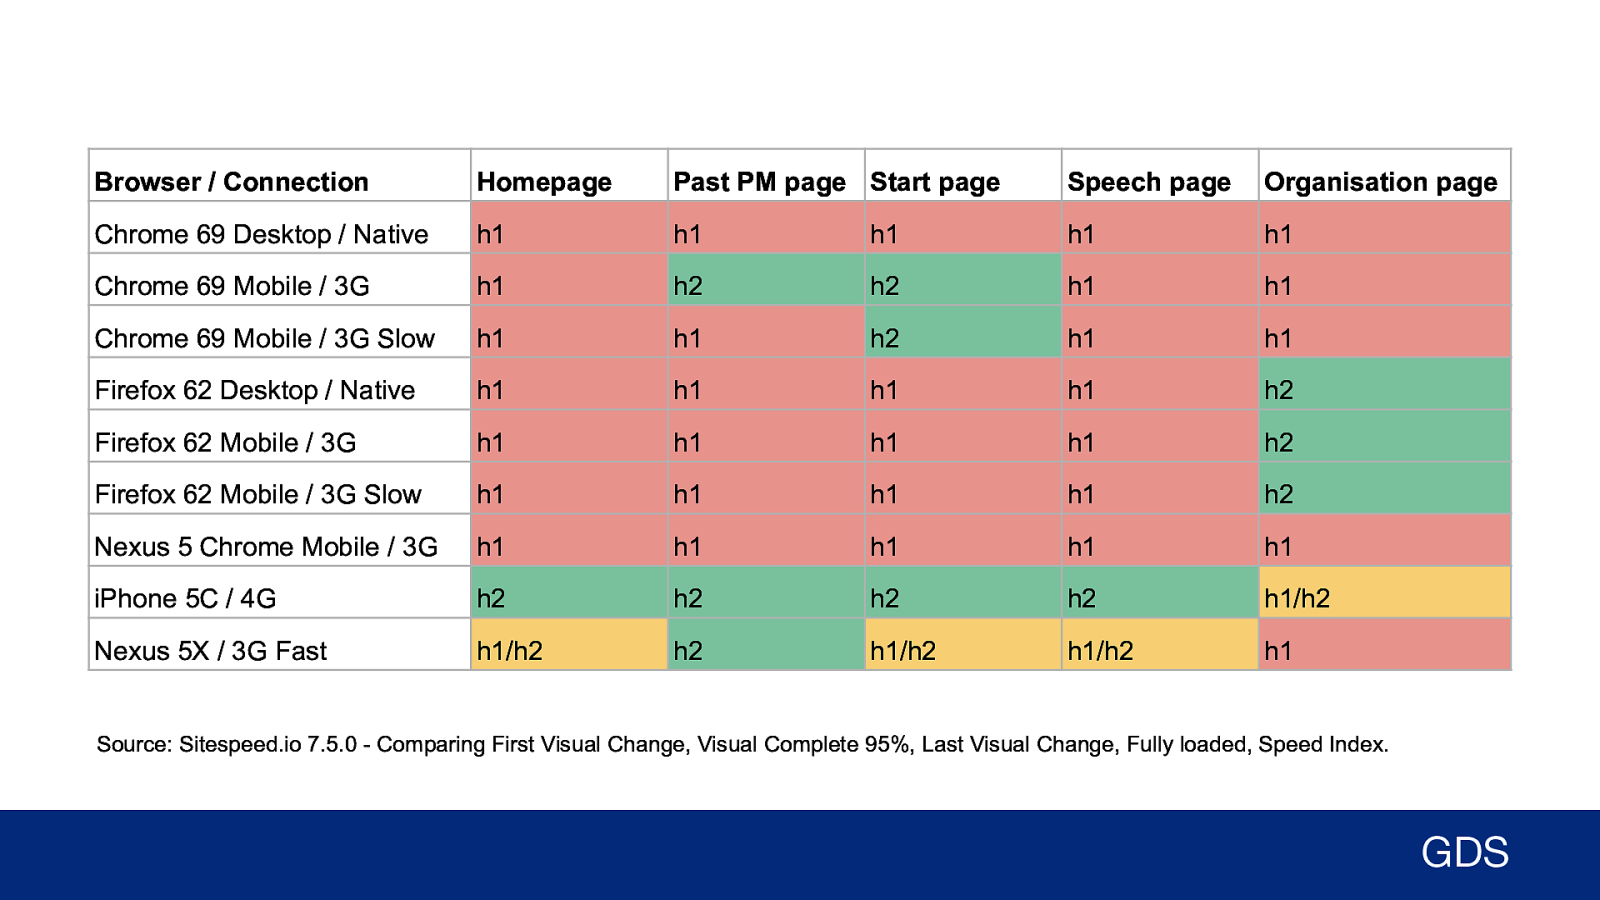
Browser / Connection Homepage Past PM page Start page Speech page Organisation page Chrome 69 Desktop / Native h1 h1 h1 h1 h1 Chrome 69 Mobile / 3G h1 h2 h2 h1 h1 Chrome 69 Mobile / 3G Slow h1 h1 h2 h1 h1 Firefox 62 Desktop / Native h1 h1 h1 h1 h2 Firefox 62 Mobile / 3G h1 h1 h1 h1 h2 Firefox 62 Mobile / 3G Slow h1 h1 h1 h1 h2 Nexus 5 Chrome Mobile / 3G h1 h1 h1 h1 h1 iPhone 5C / 4G h2 h2 h2 h2 h1/h2 Nexus 5X / 3G Fast h1/h2 h2 h1/h2 h1/h2 h1 Source: Sitespeed.io 7.5.0 - Comparing First Visual Change, Visual Complete 95%, Last Visual Change, Fully loaded, Speed Index. GDS After 4 weeks it was decided to disable it, as according to our synthetic testing it was actually decreasing performance for many users. The reason for this decrease is because we have a separate assets domain that acts as a bottleneck under HTTP/2. This is called domain sharding and is a performance optimisation used in HTTP/1.1, but can cause problems in HTTP/2. At the moment we are working to remove this separate domain. Once completed we will trial HTTP/2 again and re-evaluate.
Slide 82
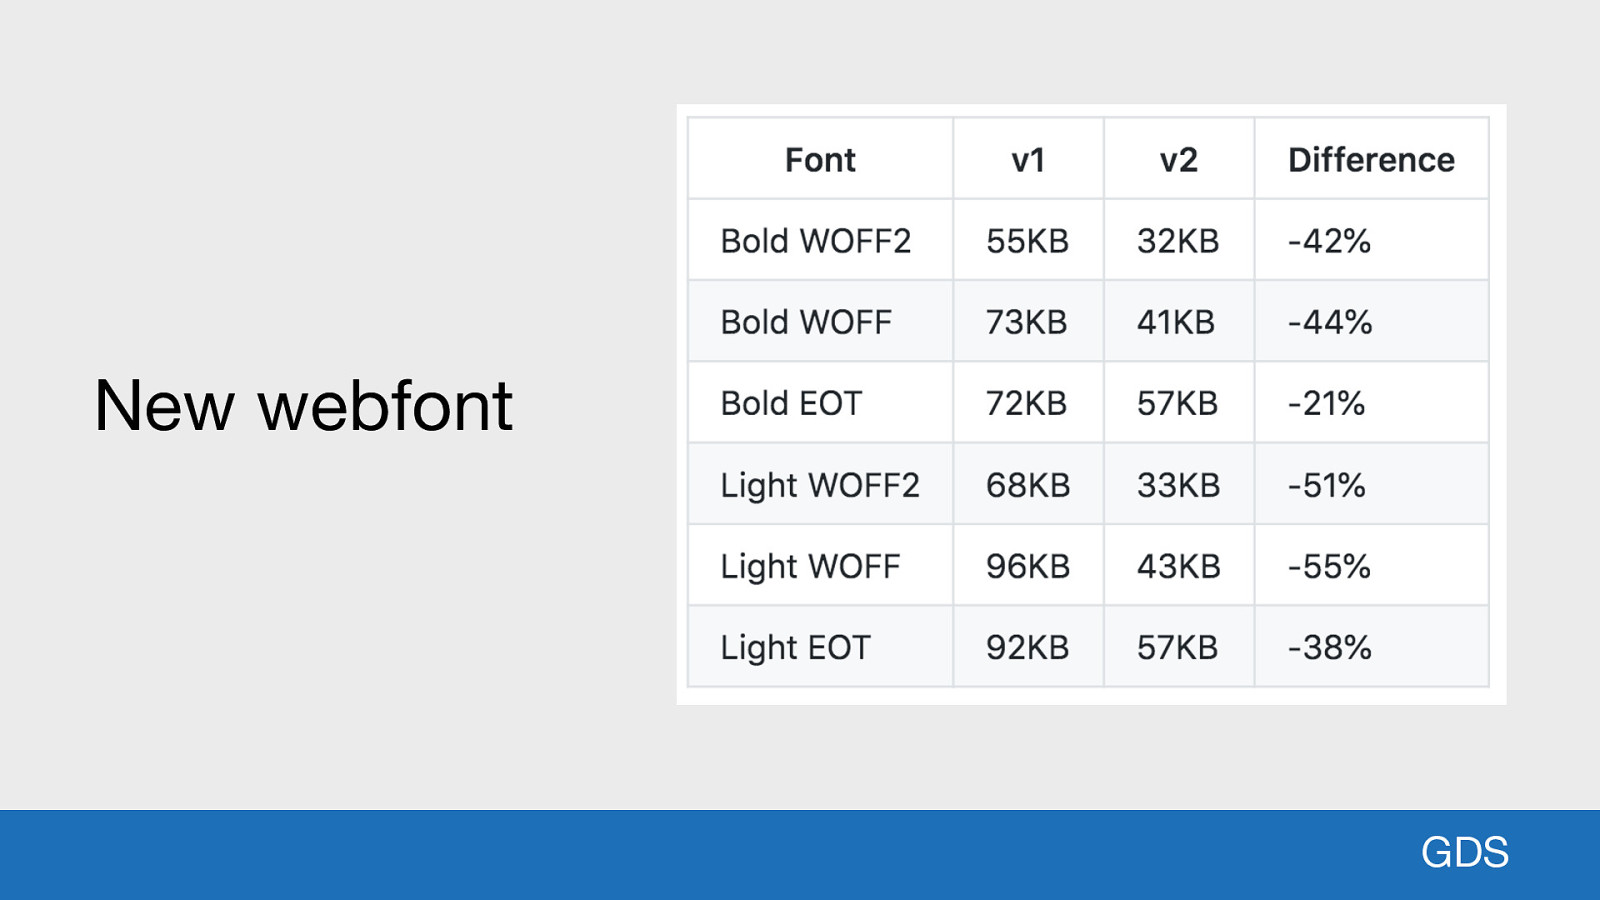
New webfont GDS Web Open Font Format version 2 (WOFF2) is a font type now supported by all modern browsers. Webfonts are a prime candidate for optimisation. We have a new optimised WOFF2 version of the GOV.UK font, which reduces data required by 47% for both font weights we use. This was added in the latest version of the GOV.UK Design system and is gradually being rolled out across all our services.
Slide 83
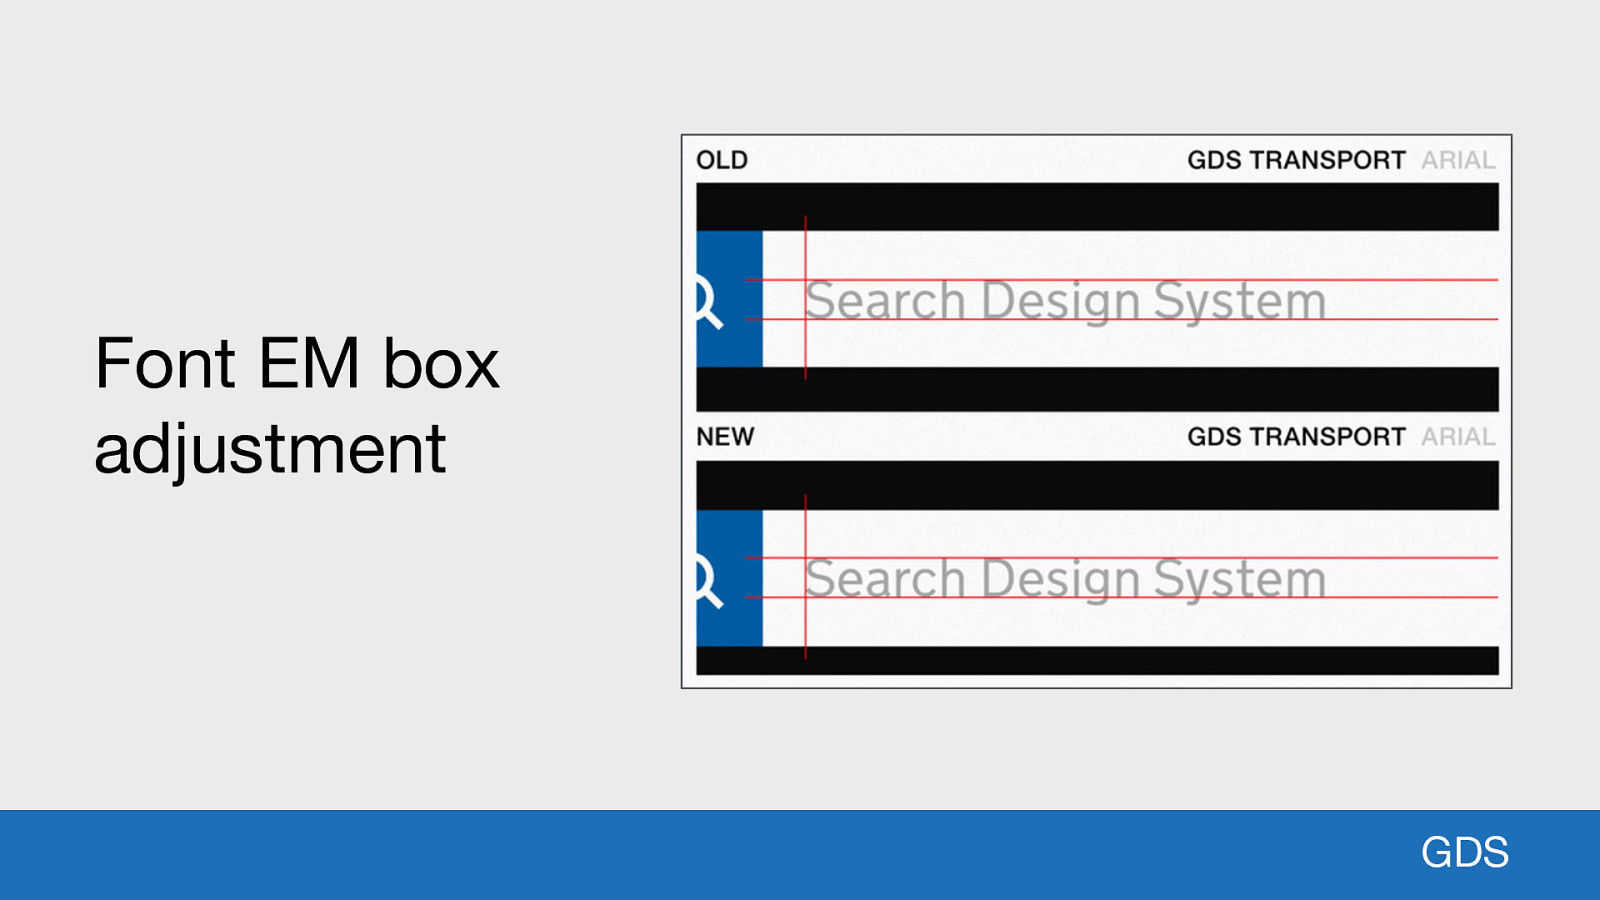
Font EM box adjustment GDS In addition to the WOFF2 font size optimisations, we’ve also taken the opportunity to make other adjustments too. Here’s a GIF showing version 1 of the font at the top, and version 2 at the bottom. If you look closely you will see a vertical shift between the fallback font and the web font in version 1. This is because the glyphs for the old version of the font sit too high in the “EM box” (bounding box) compared to our fallback font, Arial. Now if you compare this to version 2 at the bottom, the optimised version of the font. You get the shifting in the horizontal axis since the kerning of each font is different, but you don’t get the horrible shift in the vertical axis.
Slide 84
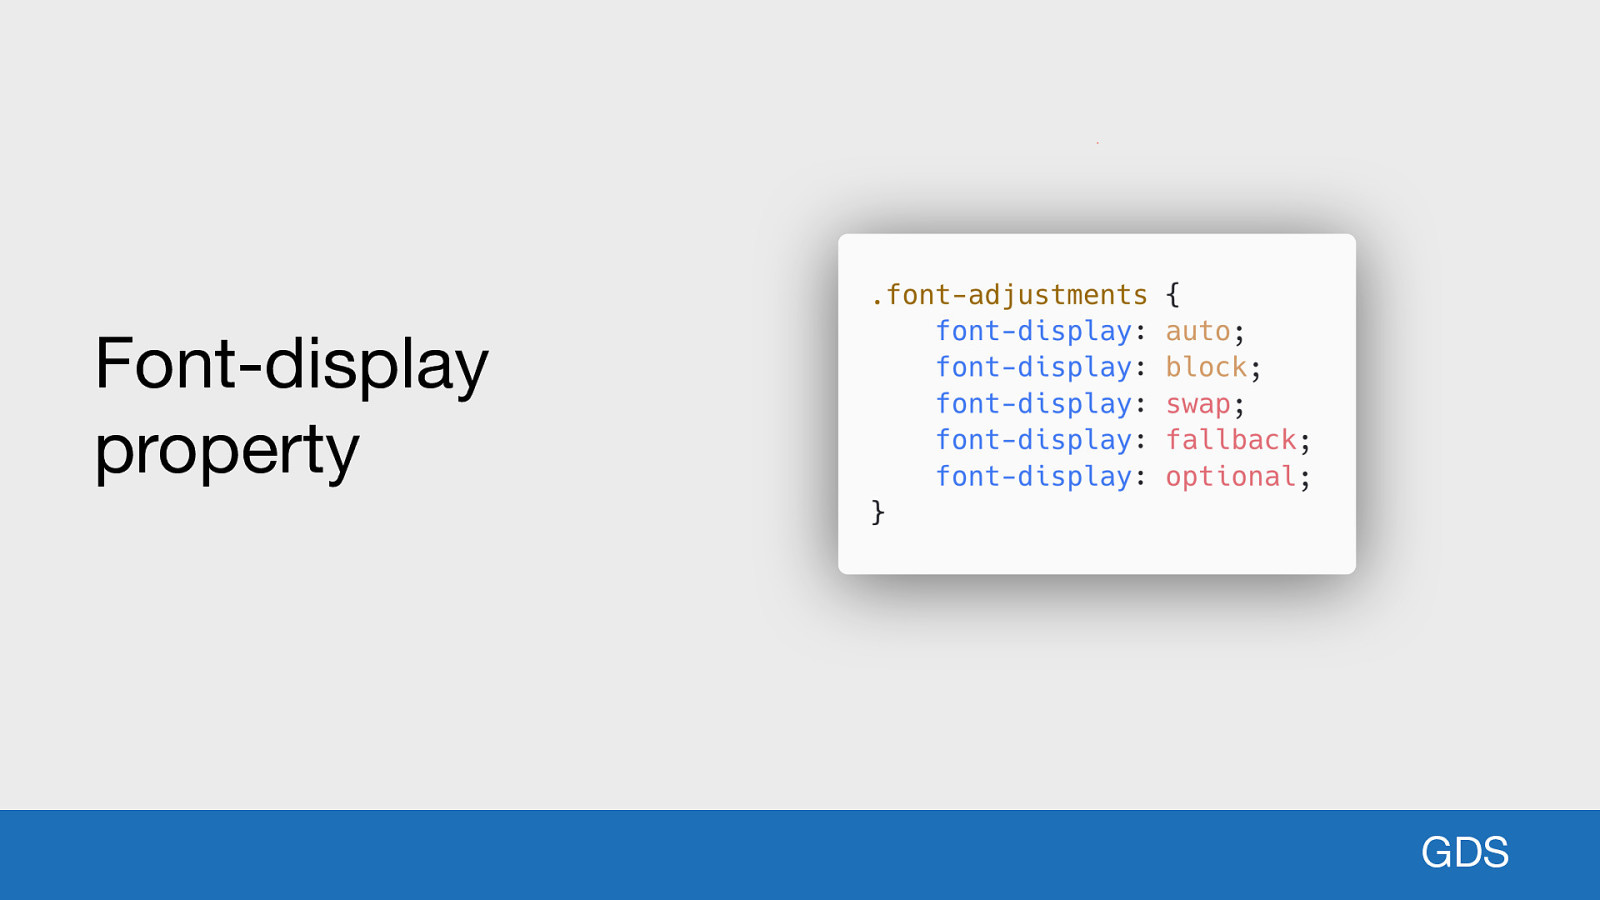
Font-display property
GDS
This has now given us an easy route into using the new CSS font-display property. Whereas before we would have an ugly shifting occur from the fallback font to the webfont once it was loaded, now the baselines are aligned, it isn’t as noticeable. Using font-display swap removes the blocking period (which causes the Flash of Invisible Text), and immediately displays the fallback font to the user. Once the web font is loaded it is swapped out with no ugly vertical shift as seen in version 1. From a users POV this will improve perceived performance, as they get to see the content of the page immediately.
Slide 85
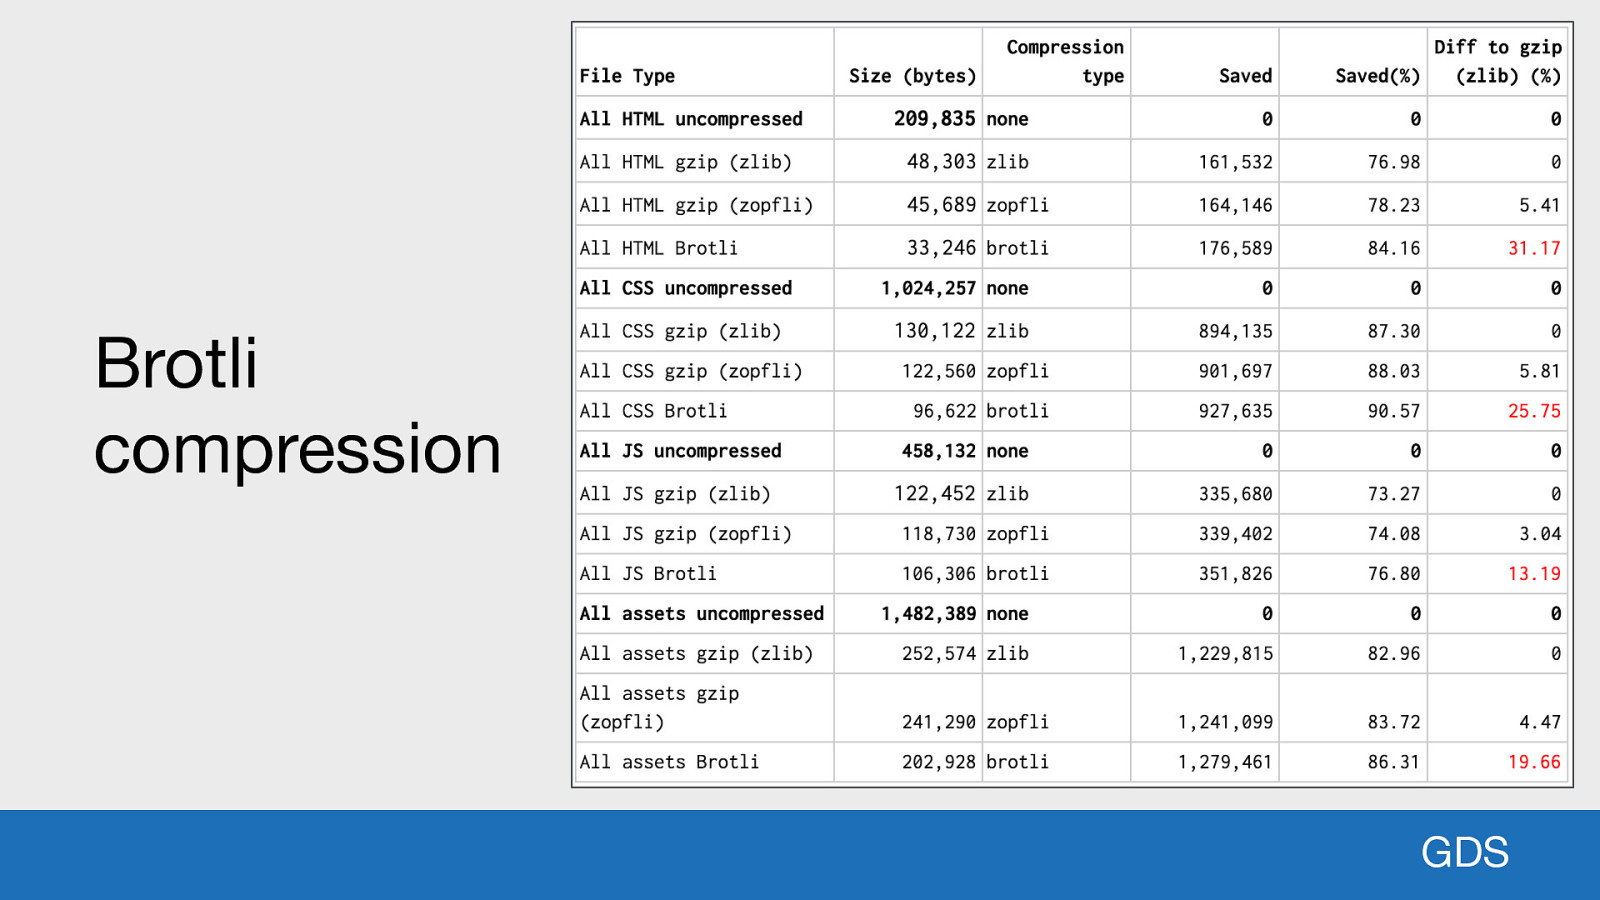
Brotli compression GDS Brotli is a new compression algorithm supported by modern browsers. It promises up to 25% better compression than gzip, which many websites may already use. We’re investigating the use of Brotli compression for HTML, CSS and JavaScript. From our initial tests, it has shown a 20% improvement in data transferred over the network, compared to our current gzip implementation.
Slide 86

Image lazy loading GDS As many of you may know, Chrome very recently enabled native image and iframe lazy loading. We are trialing it on a very image heavy page on GOV.UK: the past Prime Ministers page.
Slide 87
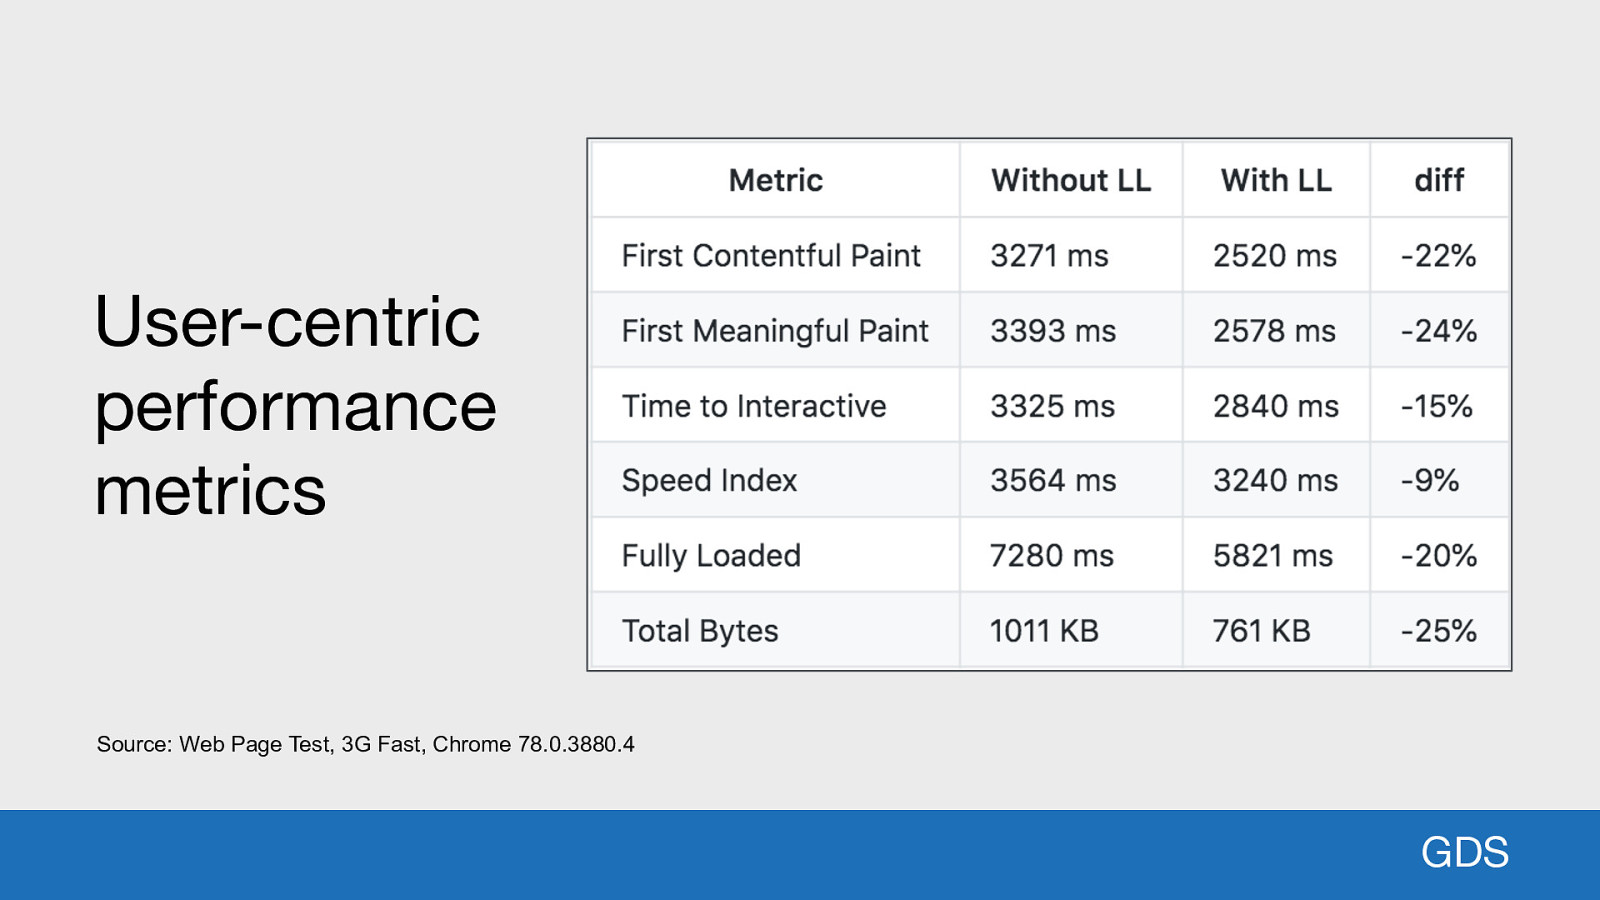
User-centric performance metrics Source: Web Page Test, 3G Fast, Chrome 78.0.3880.4 GDS We’ve seen some great performance improvements on this page using the technique, including a 22% reduction in First Contentful Paint and a 25% reduction bytes transferred. So this is something we will roll out across our applications in the future.
Slide 88

Guidance Web performance at GDS isn’t always about the hands-on practical code changes. We also offer guidance for both internal and external teams all across government.
Slide 89

GOV.UK Service Manual GDS The GOV.UK Service Manual exists to help teams across government create and run great public services that meet the Service Standard. It offers guidance on areas such as: ● ● ● ● Accessibility and assisted digital User research Design Technology
Slide 90
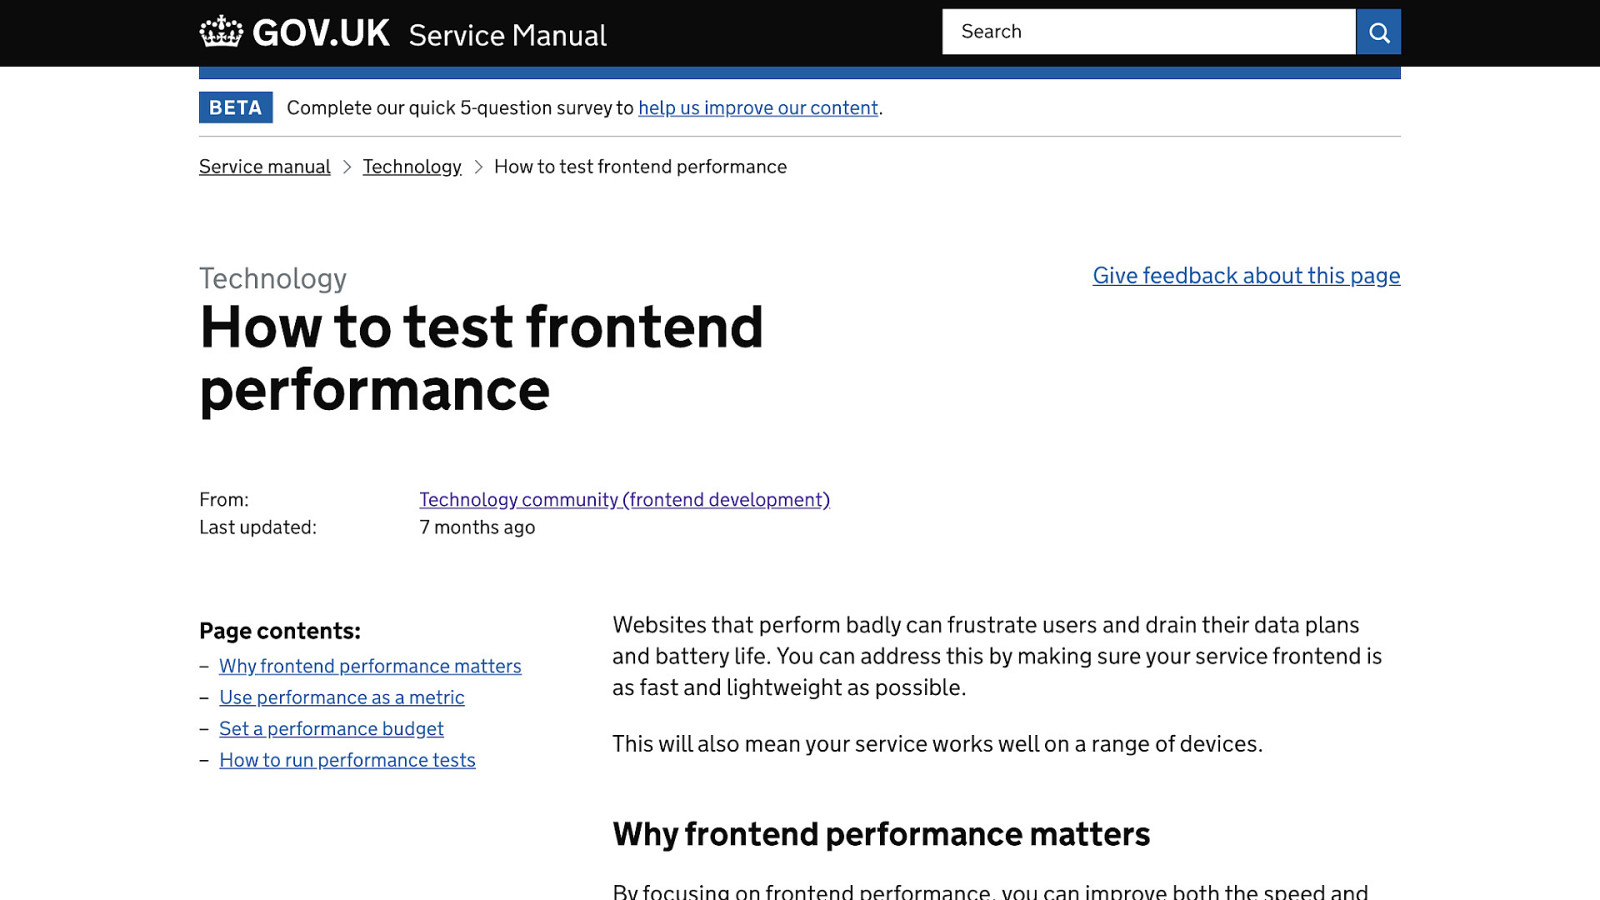
The Frontend community offer guidance around the use of Progressive Enhancement, what browsers and devices to design and test for, and more specifically for this talk “How to test frontend performance”. It gives advice on setting a performance budget, how to run performance tests and why frontend performance matters.
Slide 91

Service Standard GDS The service standard is a set of 14 points a service should meet before it goes fully live.
Slide 92
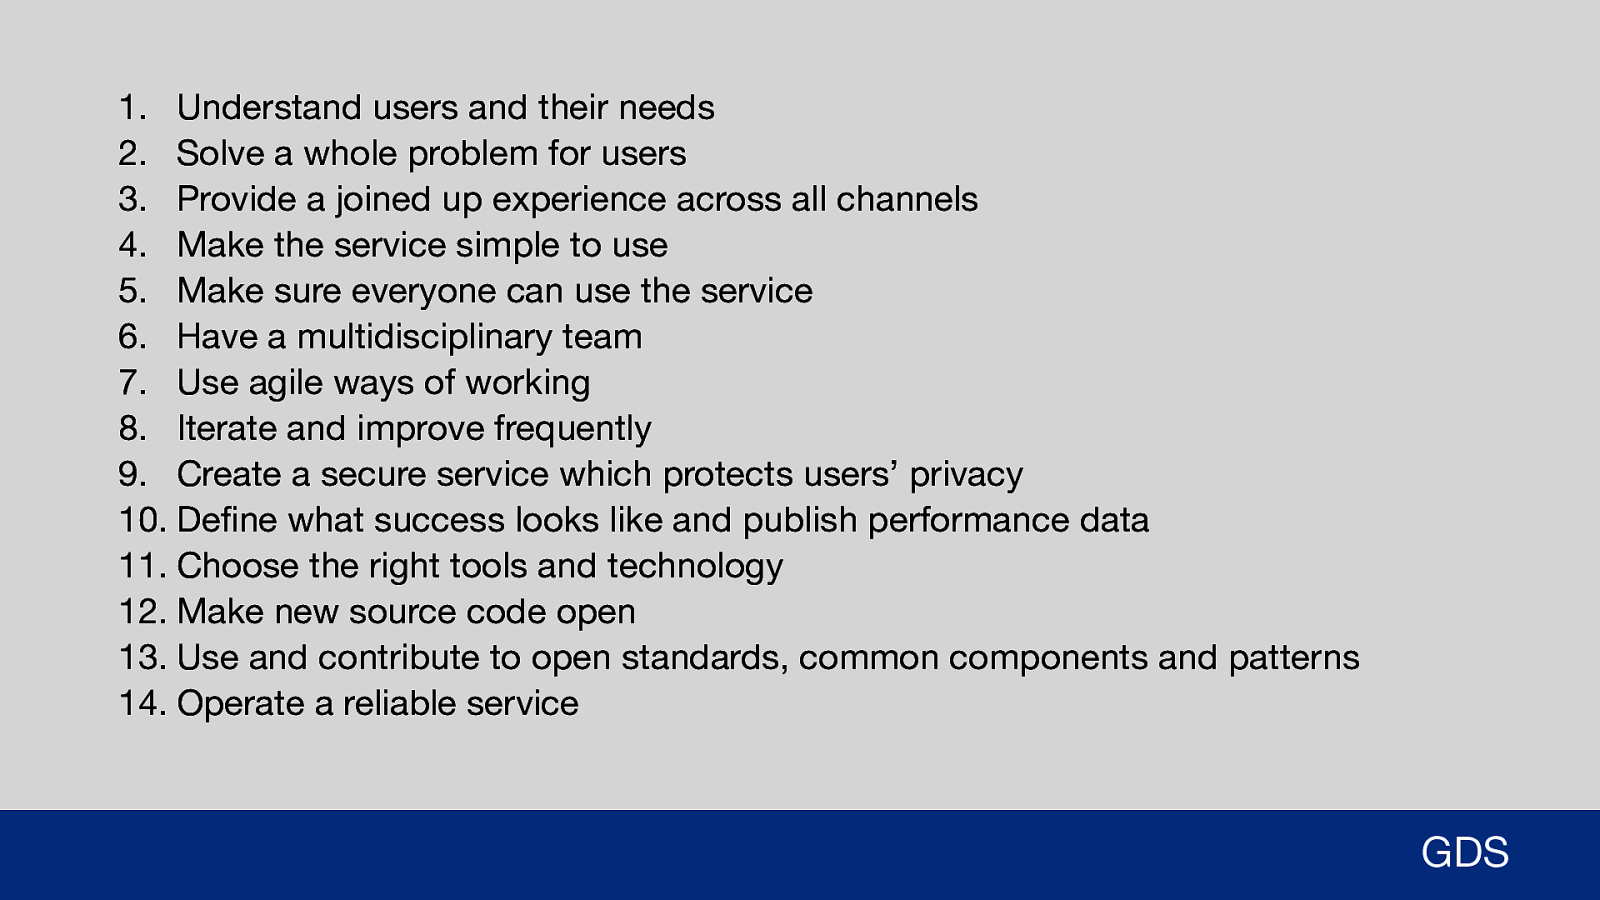
- Understand users and their needs 2. Solve a whole problem for users 3. Provide a joined up experience across all channels 4. Make the service simple to use 5. Make sure everyone can use the service 6. Have a multidisciplinary team 7. Use agile ways of working 8. Iterate and improve frequently 9. Create a secure service which protects users’ privacy 10. Define what success looks like and publish performance data 11. Choose the right tools and technology 12. Make new source code open 13. Use and contribute to open standards, common components and patterns 14. Operate a reliable service GDS If a service is likely to handle more than 100,000 transactions per year, or be used by civil servants in more than one organisation, it will need to go through a service assessment. The service will be scored on each of these points at the three developments stages: Alpha, Beta, and Live. At the moment Frontend Web Performance isn’t a part of the Service Standard, but I’m in discussions with various internal people to hopefully include it in the future.
Slide 93

GOV.UK Design System GDS Building on point 13 in the Service Standard which is: “Use and contribute to open standards, common components and patterns” We have the GOV.UK Design System.
Slide 94
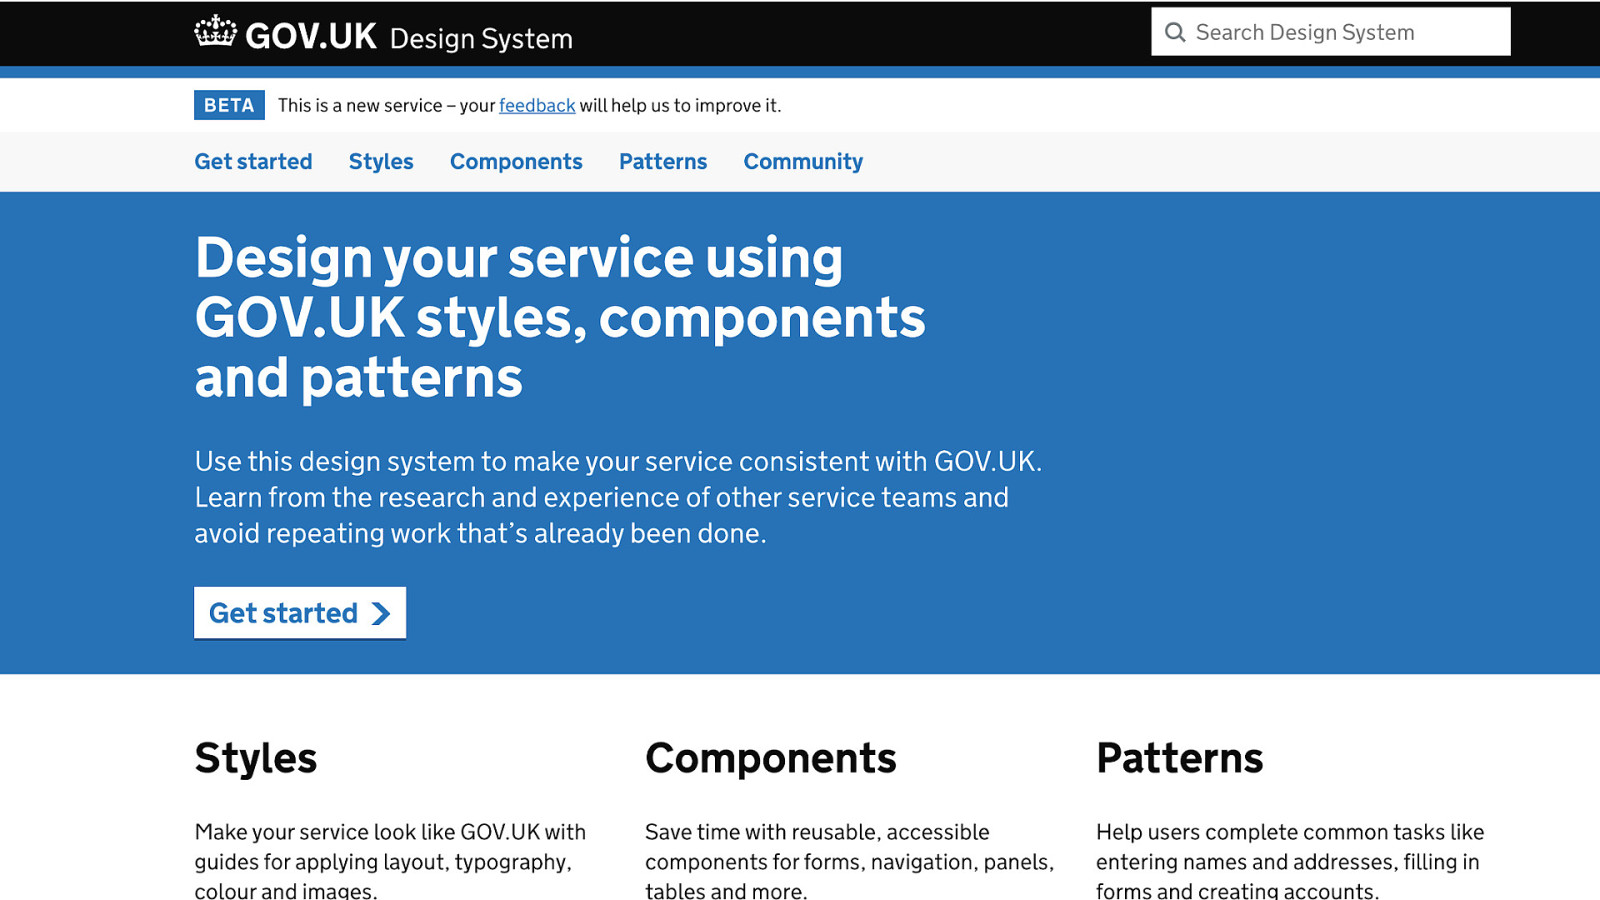
As I mentioned earlier, the Design System is a set of styles, components, and patterns to make services consistent with GOV.UK. We have a number of internal services at GDS now using the Design System components to build their frontend. We’ve also seen many other government departments using it too, including the Department for Education, the Ministry of Justice, the Home Office as well as many others. The great thing about having a single common frontend codebase across multiple services and departments, is that any web performance improvements can be quickly rolled out to any other services using it. Version 3 of the GOV.UK Frontend included the new improved WOFF2 fonts. Any service using it, can now take advantage of the filesize savings it brings.
Slide 95

Digital, Data and Technology Profession GDS The Digital, Data and Technology Profession, or DDaT for short, was formed to help all departments across government attract, develop and retain the people and skills they need to achieve government transformation.
Slide 96
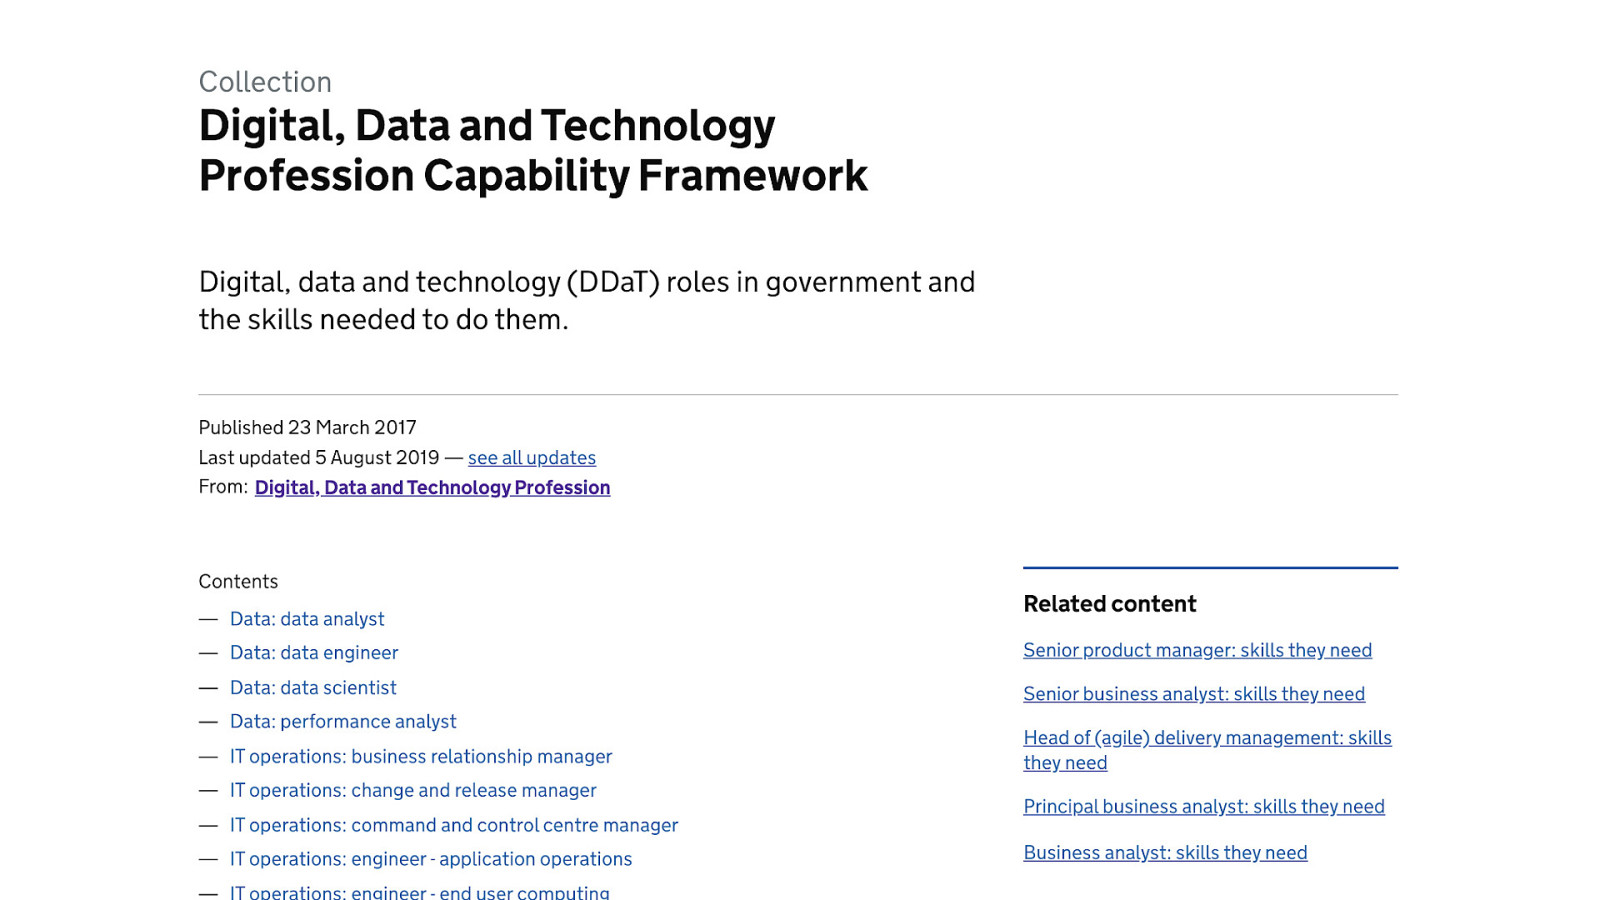
DDaT has a capability framework that defines job roles in government and the skills needed to do them. Some of the roles included are: ● ● ● ● Technical Architect Interaction Designer Technical writer and many more… You may be surprised to hear that there isn’t a definition for a Frontend Developer in the DDaT. This can cause issues with recruitment and retention across government. This is something I, along with a few people in my community have been working on. I submitted a draft definition for the job role two weeks ago and it is currently being reviewed by other government departments before it can be finalised. You’re probably asking the question: “What has this got to do with web performance?”
Slide 97
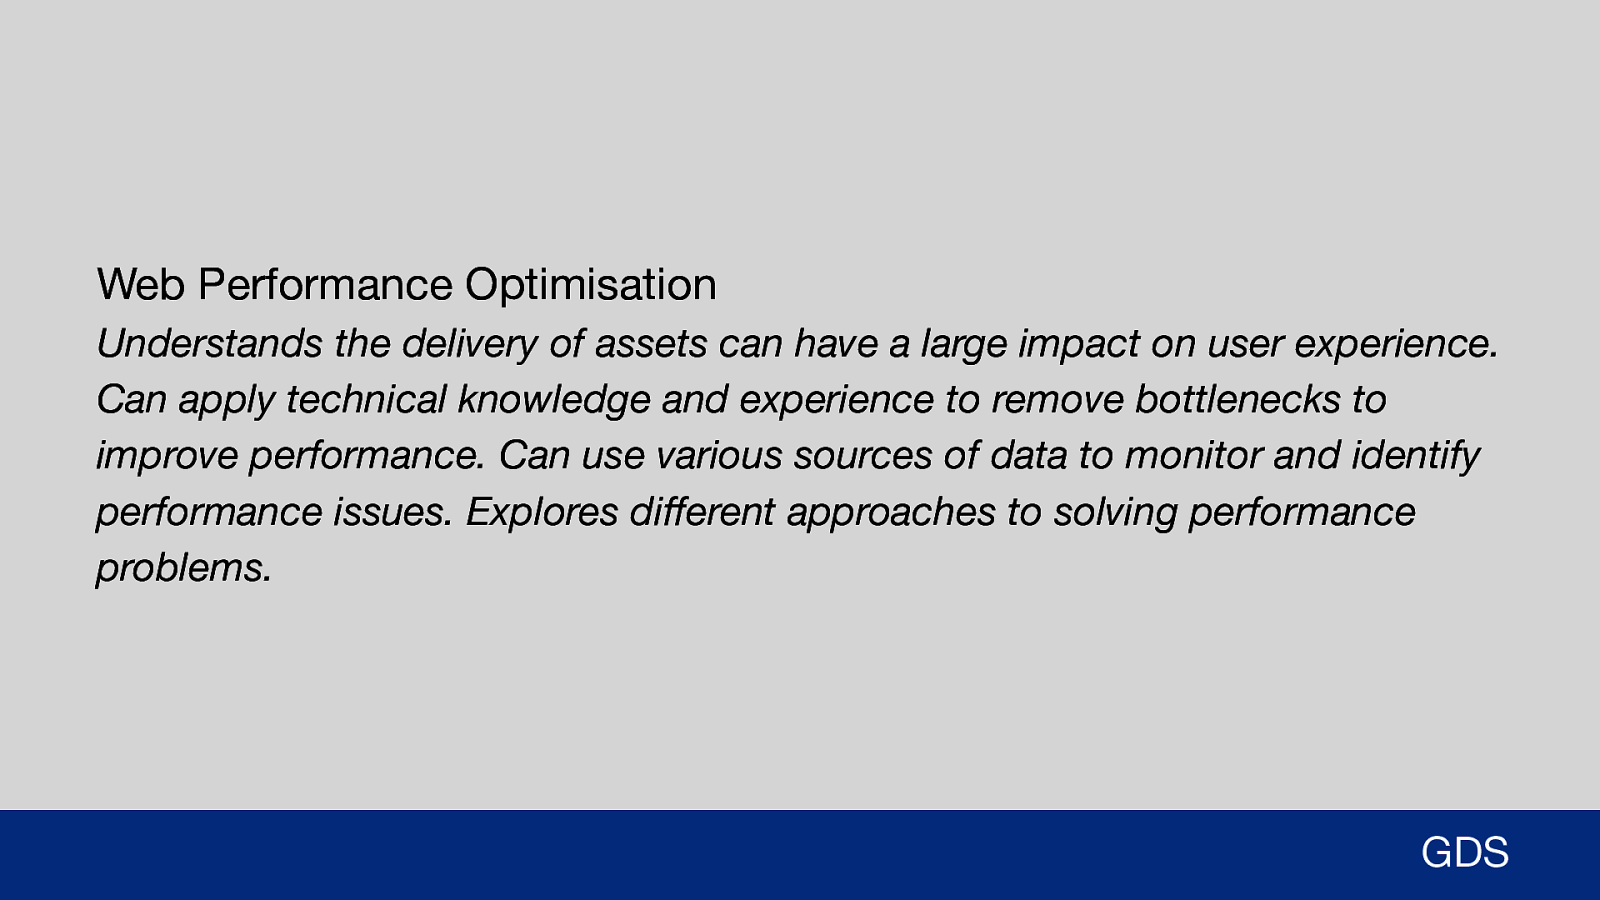
Web Performance Optimisation Understands the delivery of assets can have a large impact on user experience. Can apply technical knowledge and experience to remove bottlenecks to improve performance. Can use various sources of data to monitor and identify performance issues. Explores different approaches to solving performance problems. GDS Well in drafting the definition of a frontend developer in DDaT, I’ve made sure to include two skills that I personally feel are critical for any frontend developer in government: ● Accessibility ● Web Performance Optimisation By making web performance a first-class citizen for frontend development across government, teams should be able to either hire people with the right experience or provide training where required. If you are interested in working in government as a Frontend developer, I highly recommend taking accessibility and web performance seriously.
Slide 98

Technology Blogging GDS One of the many topics GDS blogs about is our Technology. We document how we’re building, assembling and running digital and technology projects across the UK government.
Slide 99
In April of this year I wrote a blog post about “Why we focus on frontend performance”. This was primarily to raise awareness that web performance is important for government services. This will enable teams to prioritise and focus on performance in the alpha and beta service phases, before it becomes a problem for many users.
Slide 100
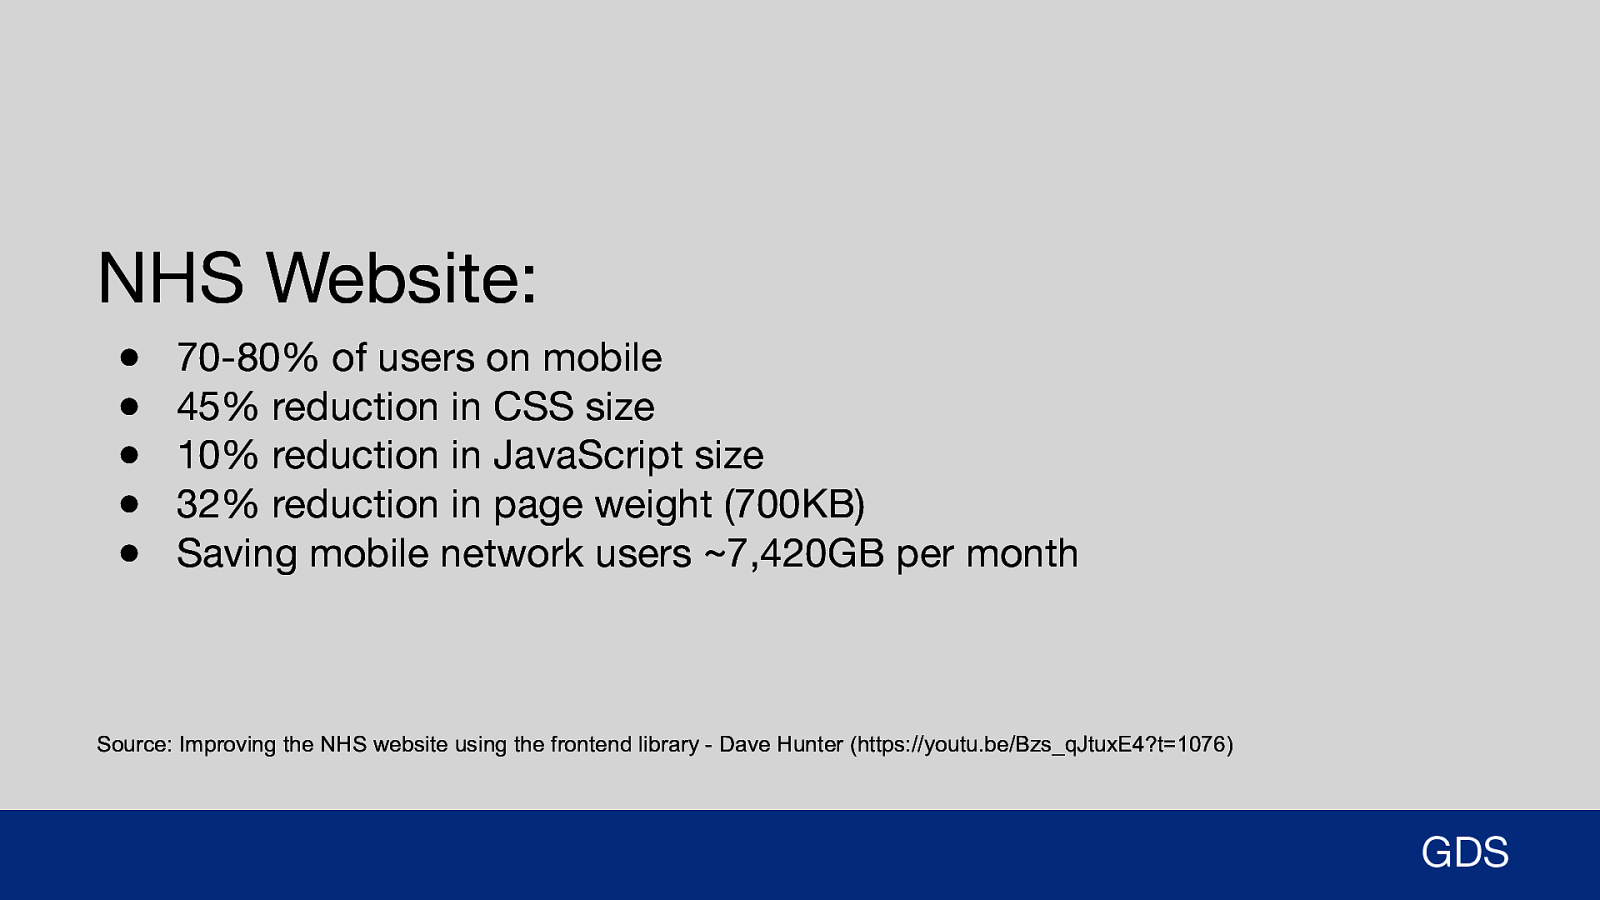
NHS Website: ● ● ● ● ● 70-80% of users on mobile 45% reduction in CSS size 10% reduction in JavaScript size 32% reduction in page weight (700KB) Saving mobile network users ~7,420GB per month Source: Improving the NHS website using the frontend library - Dave Hunter (https://youtu.be/Bzs_qJtuxE4?t=1076) GDS I’d just like to take a moment to give a shout-out to the NHS Digital team, who have been doing some fantastic web performance work to improve the NHS website this year. Apparently the blog post I wrote was the inspiration for some of the improvements they made in this area, which I am extremely happy about. Reflecting on what I’ve just said about GOV.UK users in the past slides, it’s easy to imagine many of the users of the NHS website being on a mobile connection, inside large hospital, under potentially very stressful conditions (either themselves or a family member unwell). So any improvements they are working on to make the website faster and more accessible will be a huge benefit to those users.
Slide 101

Final thoughts Although I’ve approached this talk from the P.O.V. of a government service, there’s no reason this can’t all be applied to a website in any sector.
Slide 102
GDS After all, this is a problem that is true for every website in every sector. With more rich-media content being added to websites, they are increasing in size year on year.
Slide 103
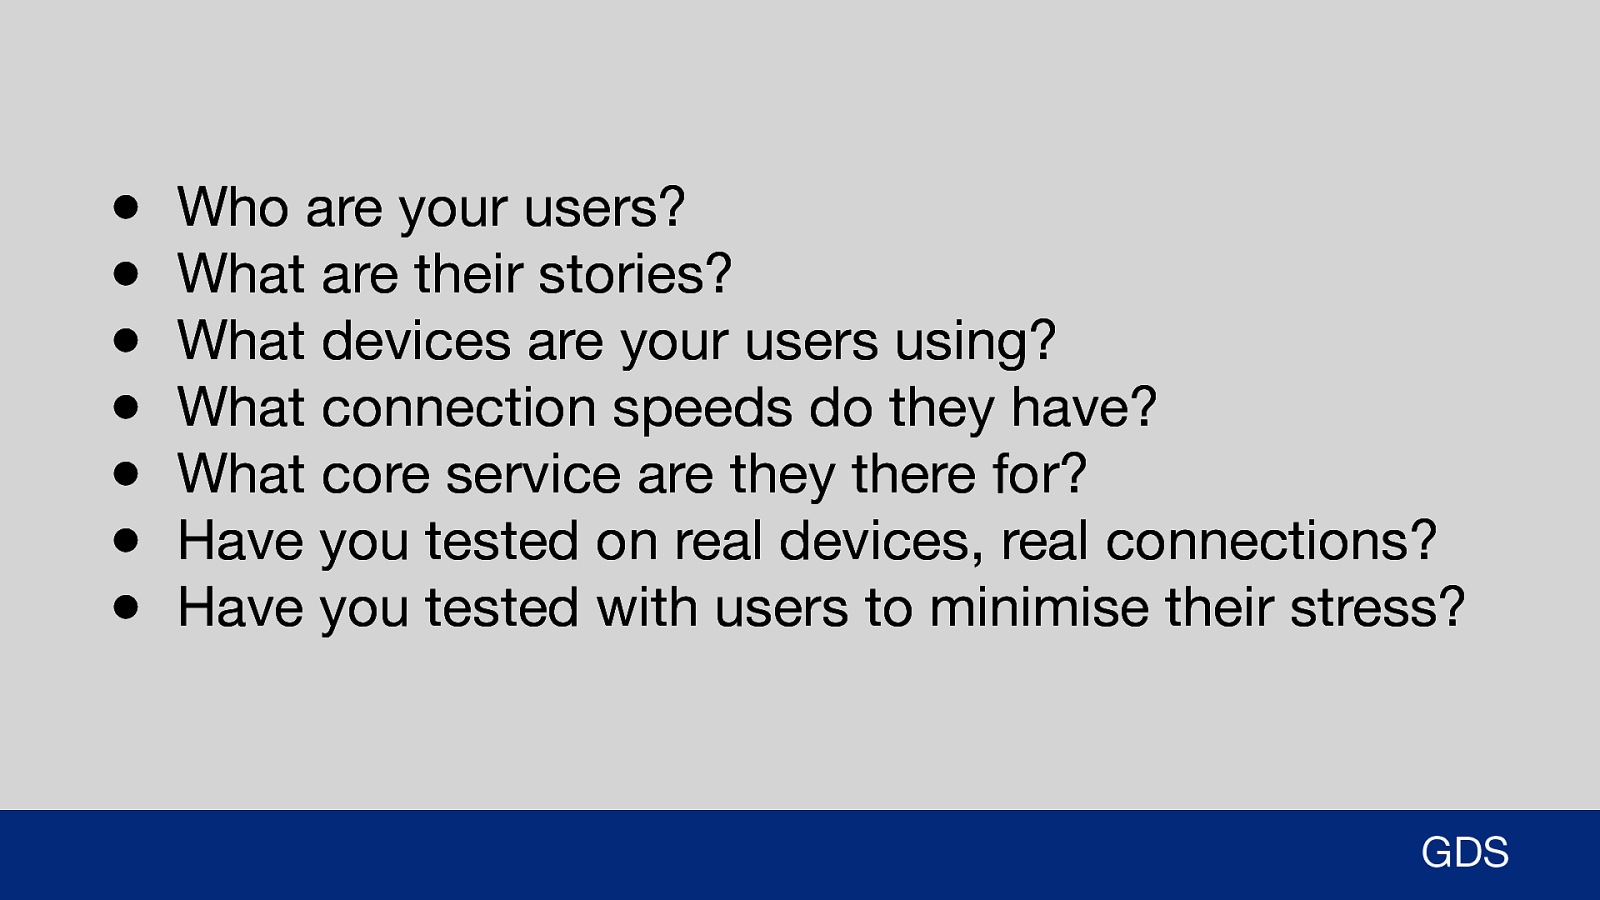
● ● ● ● ● ● ● Who are your users? What are their stories? What devices are your users using? What connection speeds do they have? What core service are they there for? Have you tested on real devices, real connections? Have you tested with users to minimise their stress? GDS So how can you improve web performance and help your business? Start by focusing on your users: ● ● ● ● ● ● Who are they? What are their stories? What devices & connections are they using? Why are your users on your website (core service)? Have you tested on real devices and connections that they use? Have you tested with users to minimise their stress?
Slide 104

Be inclusive, not exclusive GDS Above all else, strive to be inclusive, not exclusive.
Slide 105

Empathy Frontend web performance matters. At its heart it’s about showing empathy and understanding that every user has different needs: ● Every user doesn’t have the latest handset or laptop. ○ What about older devices? ● Every user doesn’t have a 100Mbit connection in a major city. ○ What about users in rural areas on an unstable connection? ● Every user isn’t just browsing for their leisure. ○ What about users trying to complete an important and stressful task? We don’t know who all our users are or what their exact situation is, so we can’t just assume we do.
Slide 106
“Make people’s lives better… Source: Charlie Owen - Dear developer, the web isn’t about you GDS Now I’m going to borrow a quote from a talk I saw in November 2017 by frontend developer, Charlie Owen. She said: “Ultimately the job of a frontend developer is to make people’s lives better…
Slide 107
…or at least not make it worse!” Source: Charlie Owen - Dear developer, the web isn’t about you GDS …or at least not make it worse!” And by improving frontend web performance, you’re only going to make people’s lives better.
Slide 108

Thanks for listening! Matt Hobbs Twitter: @TheRealNooshu Thanks for listening!