Matt Hobbs Twitter: @TheRealNooshu Mastodon: @[email protected] Morning everyone! It’s an honor to be the first speaker on the second day of this amazing Web Performance conference, and I’d like to thank the Perfnow team for inviting me to speak. I feel extremely privileged to be on this stage with such incredible speakers from the Web Performance community!
Slide 1

Slide 2

Hello! 👋 My name is Matt Hobbs and until recently I was the Head of Frontend at the UK’s Government Digital Service.
Slide 3

Bridging the Digital Divide using Web Performance Today, I am delighted to speak to you about the topic of “Bridging the Digital Divide Using Web Performance”. With a specific focus on the United Kingdom. In an increasingly connected world, it is crucial to ensure that everyone has equal access to digital resources and opportunities. In this presentation, we will explore how optimizing web performance can play a significant role in bridging the digital divide. Note: the background image on this slide. I took a leaf out of Mark’s book and generated it using mid-Journey last night! So anyway, let’s get started!
Slide 4
I. Understanding the Digital Divide. First let’s understand what is the digital divide.
Slide 5
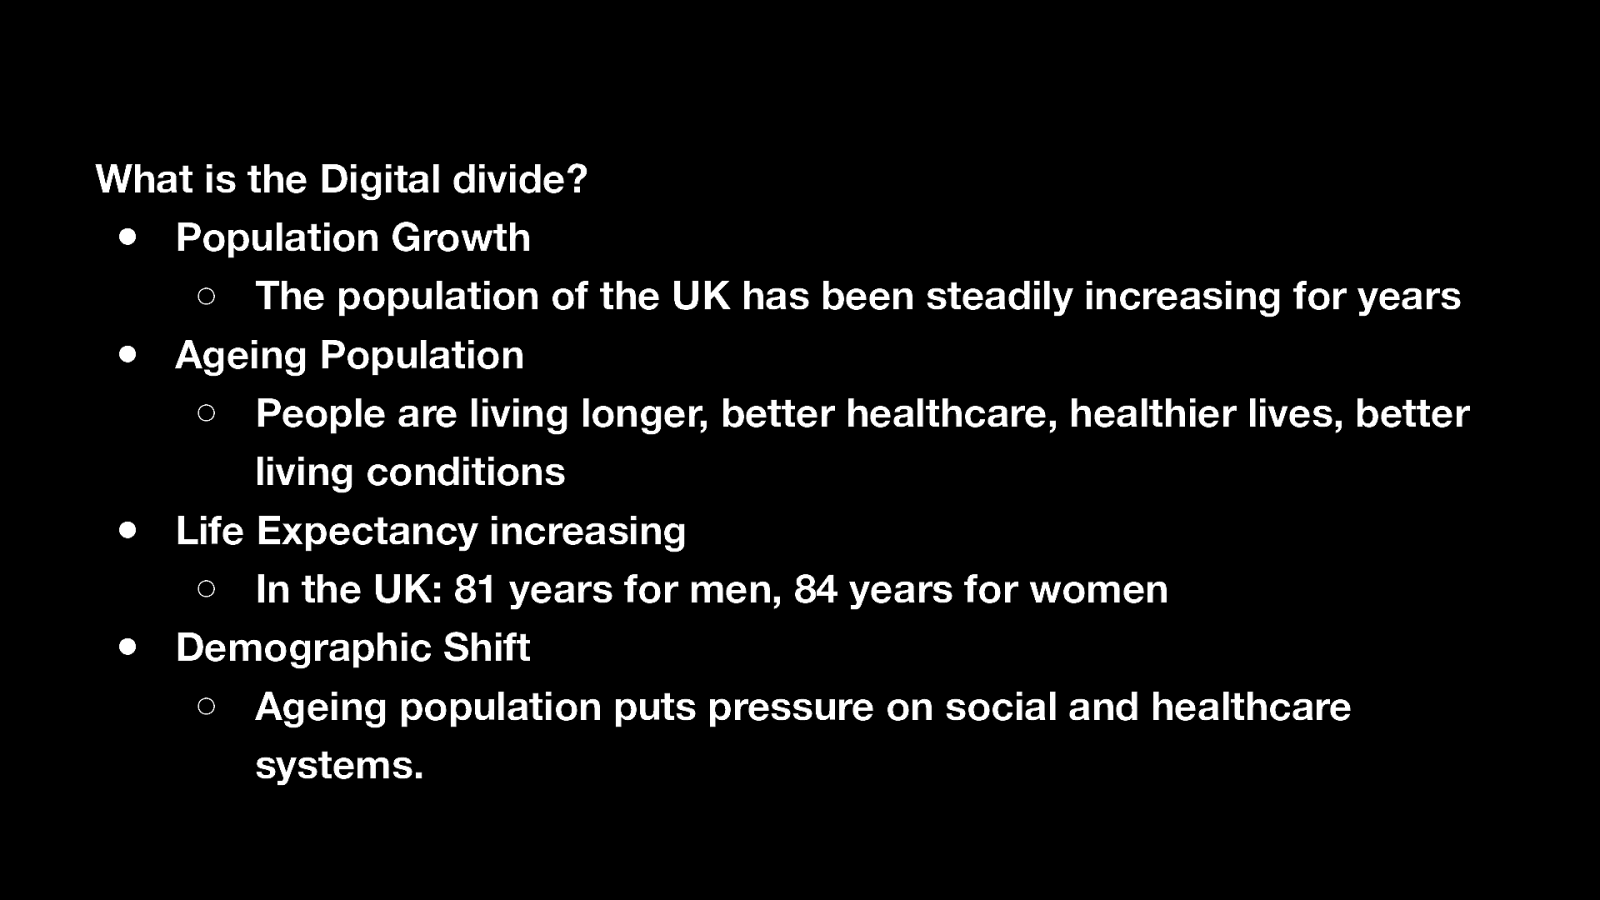
What is the Digital divide? ● Population Growth ○ The population of the UK has been steadily increasing for years ● Ageing Population ○ People are living longer, better healthcare, healthier lives, better living conditions ● Life Expectancy increasing ○ In the UK: 81 years for men, 84 years for women ● Demographic Shift ○ Ageing population puts pressure on social and healthcare systems. The UK, like many other developed countries, is experiencing an aging population. This is increasing due to longer life expectancy and lower mortality rates in older generations. A person born in the past 20 years, will have been exposed to the internet, mobile phones, and tablets, with connectivity to the whole world from a very early age. Their brain knows nothing different than looking up any question they have on a digital device. Having 2 young sons. I’ve been witness to this over the past few years as they are both very fluent with technology due to their daily usage.
Slide 6
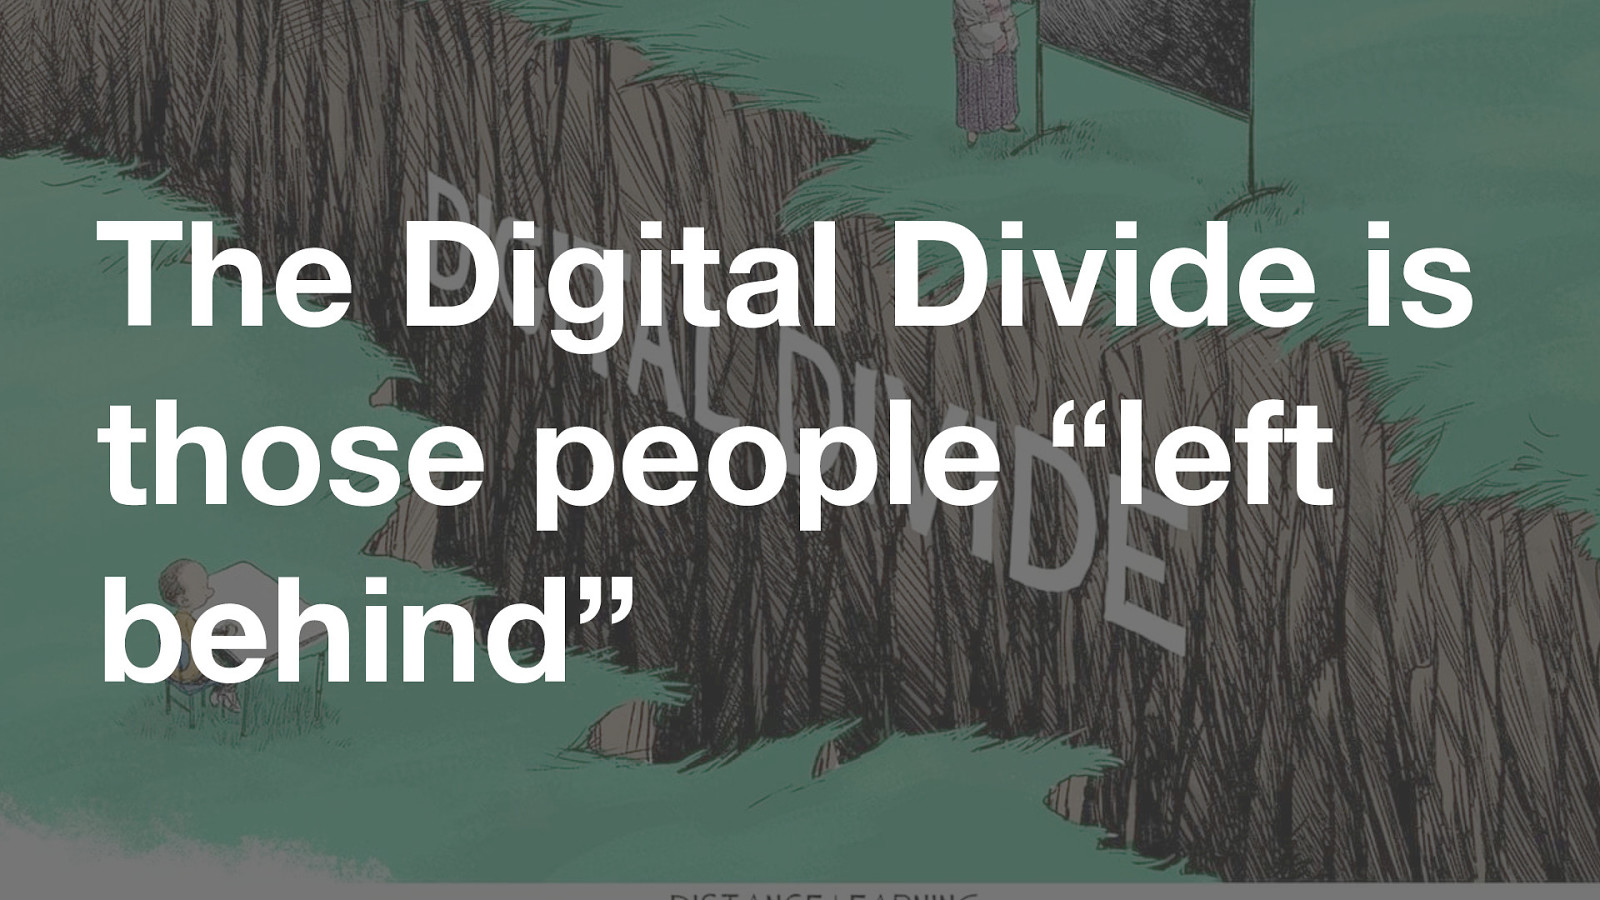
The Digital Divide is those people “left behind” The Digital divide is the gap between those who have been privileged enough to be exposed to technology and those who haven’t. Although I alluded to it in my previous slide, it’s an oversimplification to say it’s only a young vs old demographic issue. Although it’s an easy assumption to make. A major misconception that people believe when talking about the digital divide is that there’s only one. When in fact a simple division between 2 clear social categories doesn’t exist. We live in complex multifaceted societies. A more accurate way to examine the Digital divide is across entire populations. Including people’s social, economic, and cultural differences.
Slide 7
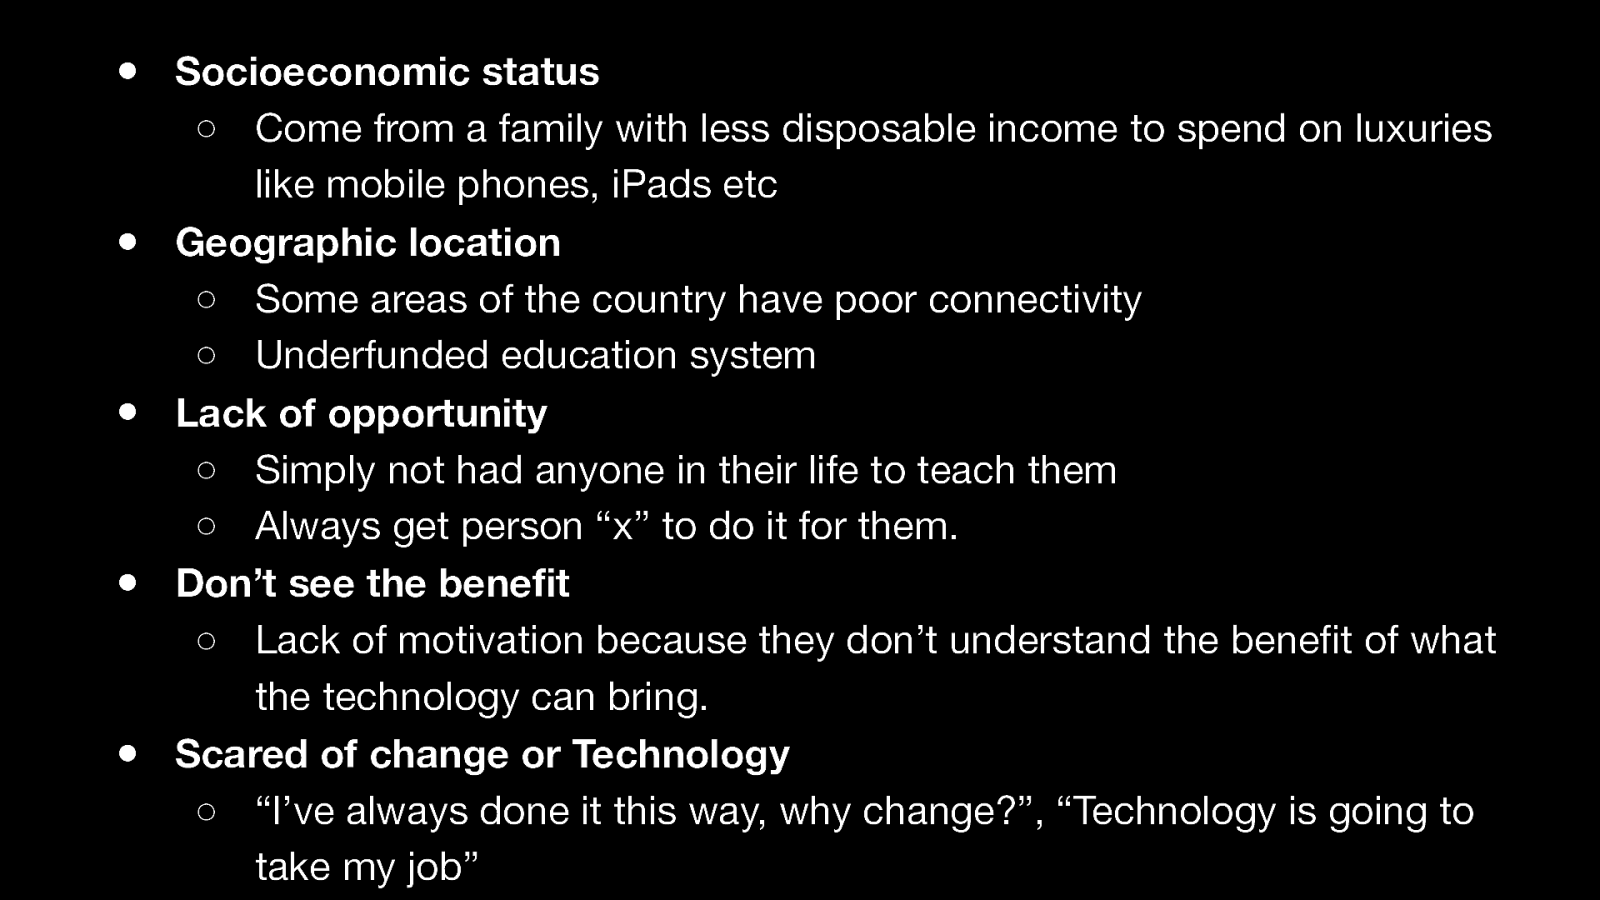
● Socioeconomic status ○ Come from a family with less disposable income to spend on luxuries like mobile phones, iPads etc ● Geographic location ○ Some areas of the country have poor connectivity ○ Underfunded education system ● Lack of opportunity ○ Simply not had anyone in their life to teach them ○ Always get person “x” to do it for them. ● Don’t see the benefit ○ Lack of motivation because they don’t understand the benefit of what the technology can bring. ● Scared of change or Technology ○ “I’ve always done it this way, why change?”, “Technology is going to take my job” There are many reasons why an individual won’t have been exposed to technology. For example: ● They come from a family with less disposable income to spend on luxuries like mobile phones, tablets and computers. ● They live in a part of the country with poor connectivity or an underfunded education system. ● They simply haven’t had the opportunity to use technology. ○ maybe they’ve had nobody to show them how to use it. ○ or a common occurrence is getting someone else to do it all for them (e.g. a family member or friend) ● Maybe they don’t understand the benefit that technology can bring. ● Or a combination of above? There are many people in society that are scared of change, and technology is a huge change! You’ll often hear comments like “I’ve always done it this way, why change now?” or “Technology is going to take my job”.
Slide 8
II. Why is it important to bridge the Digital divide? So why is it important to reduce the digital divide?
Slide 9
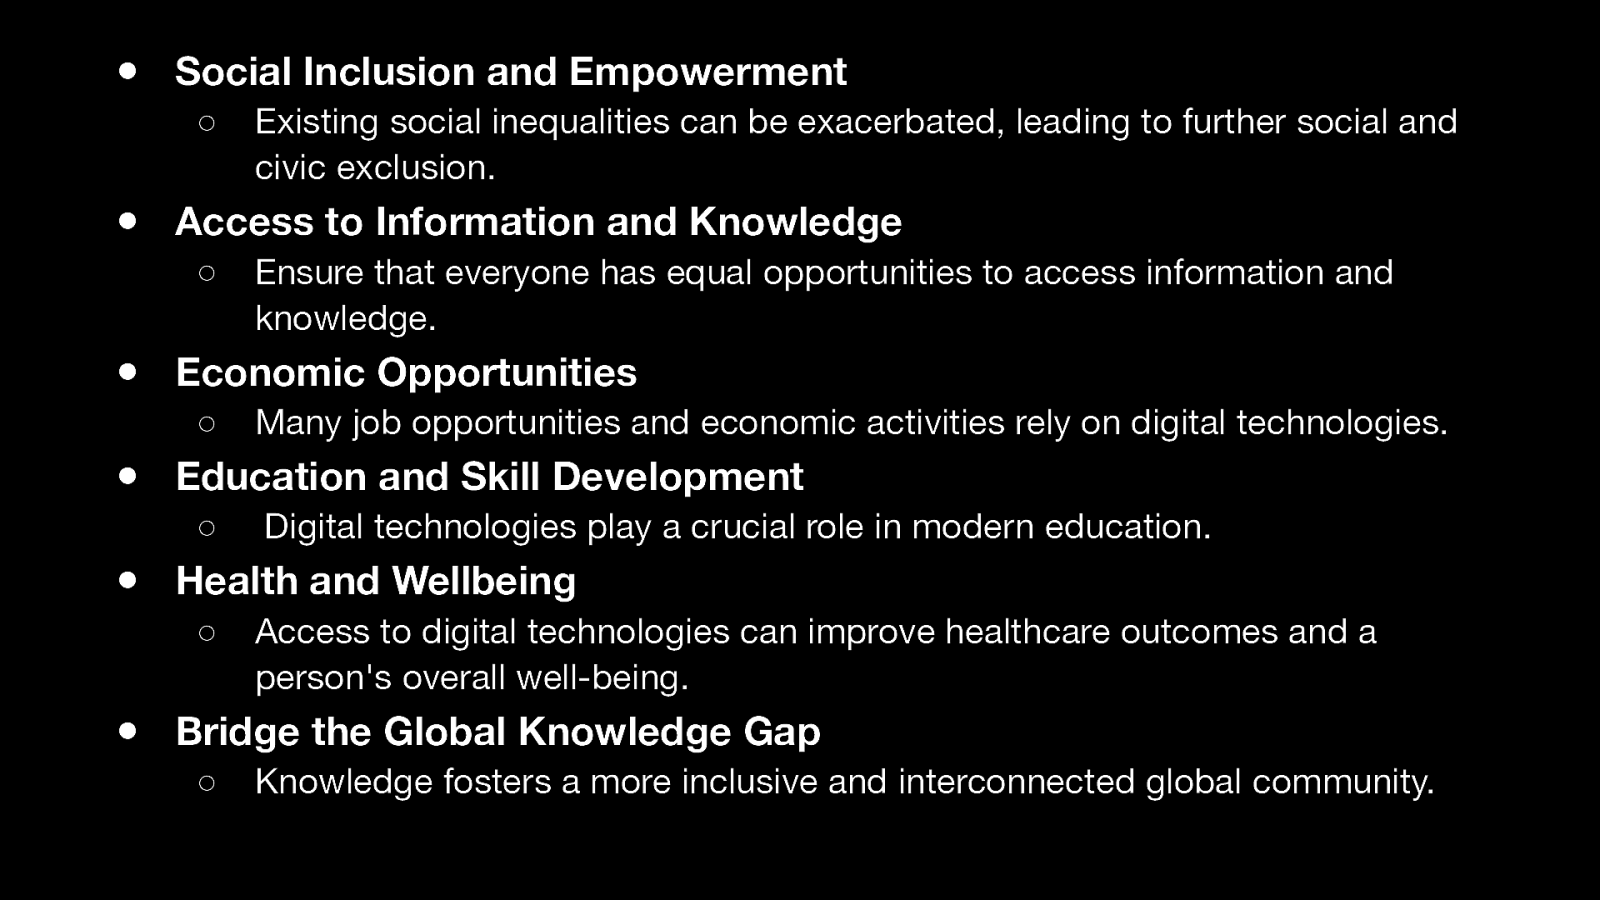
● Social Inclusion and Empowerment ○ Existing social inequalities can be exacerbated, leading to further social and civic exclusion. ● Access to Information and Knowledge ○ Ensure that everyone has equal opportunities to access information and knowledge. ● Economic Opportunities ○ Many job opportunities and economic activities rely on digital technologies. ● Education and Skill Development ○ Digital technologies play a crucial role in modern education. ● Health and Wellbeing ○ Access to digital technologies can improve healthcare outcomes and a person’s overall well-being. ● Bridge the Global Knowledge Gap ○ Knowledge fosters a more inclusive and interconnected global community. Reducing the digital divide is essential to create a more fair and inclusive society. Where everyone has equal access to information, opportunities, and the tools necessary to thrive in the digital era. A more fair and inclusive society will enable individuals and communities to take part in social, economic, and civic life, and foster development and progress for all. In turn this improves social inclusion, and access to information and knowledge. Leading to better economic opportunities, education and skills development. Bridging the global knowledge gap will create a more inclusive and interconnected global community for everyone.
Slide 10
III. How can Web Performance help? So we know the digital divide is detrimental to society and is something that we should be aiming to reduce. But how can Web Performance help do this? Web performance is a crucial factor in bridging the digital divide. Especially when users access the internet across a large range of speeds and devices. For Example: across a whole countries population. So let’s look at a few webperf topics individually:
Slide 11

- Optimised and Efficient Web Design Number 1: Optimised and Efficient Web Design. If websites and applications are well-optimized to load quickly and function smoothly, they can be more accessible to people with slower internet connections and less advanced hardware. This includes practices like efficient use of code, optimizing images and video, and prioritizing the loading of critical content. Note: my use of accessible in this context is in the literal sense of the word, allowing a user to actually access the information they need. [DRINK]
Slide 12

Rural connectivity Here I’ll share a personal experience that happened to me in July related to Digital exclusion in a rural area of the UK…
Slide 13

My family and I were recently at a friends wedding in the Lake District, in the north of the UK. This picture is of DerwentWater, around 30 miles from the border of Scotland.
Slide 14
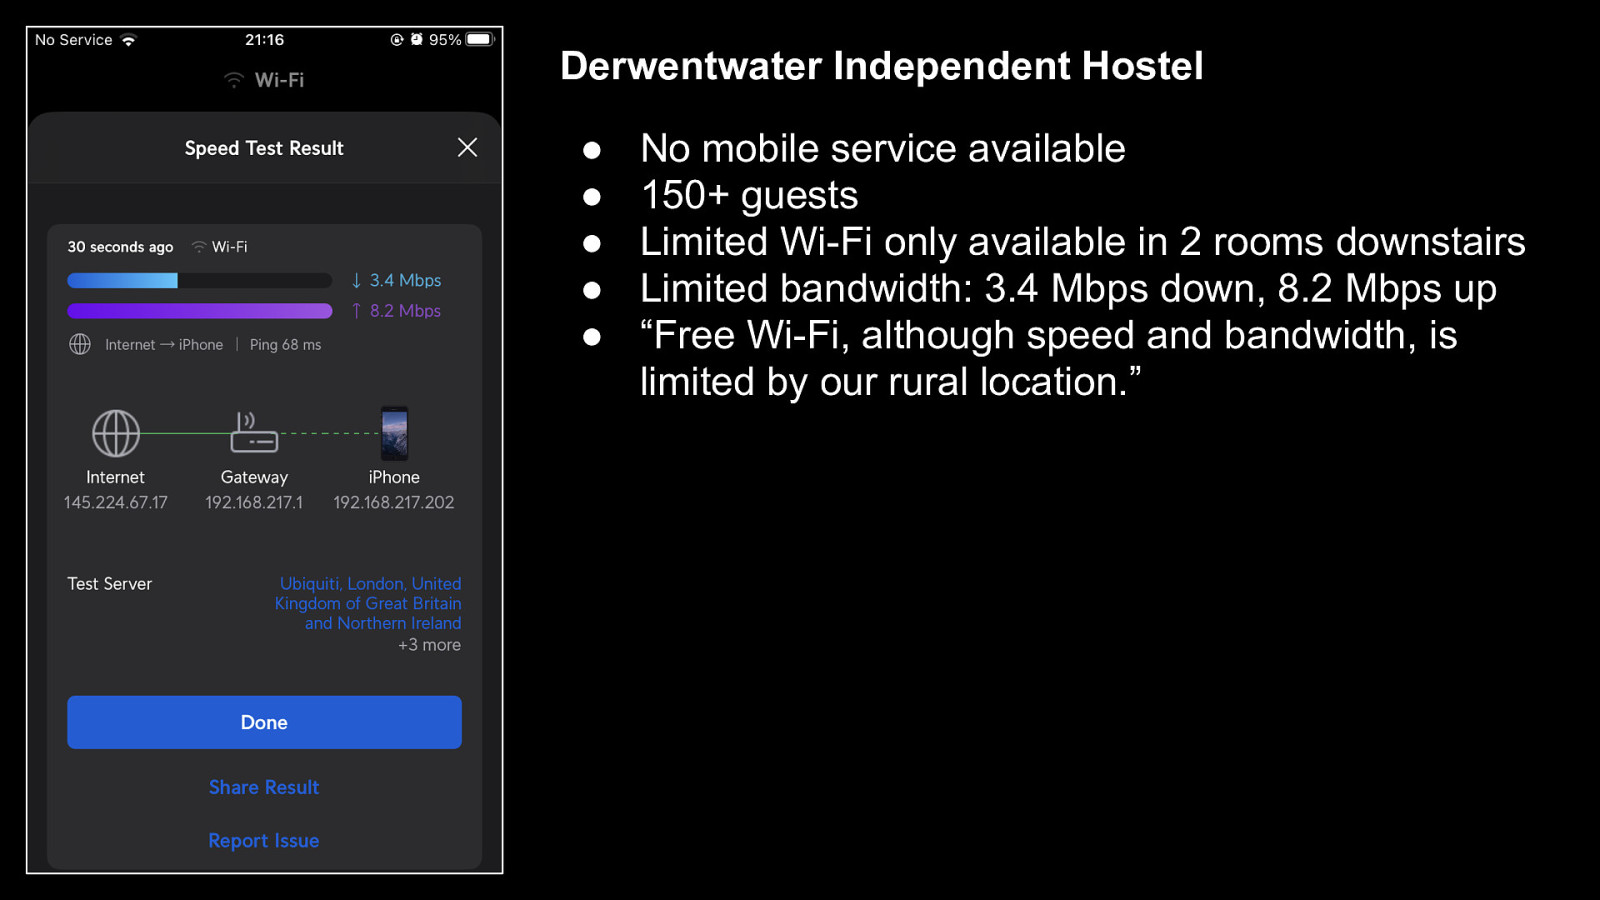
Derwentwater Independent Hostel ● ● ● ● ● No mobile service available 150+ guests Limited Wi-Fi only available in 2 rooms downstairs Limited bandwidth: 3.4 Mbps down, 8.2 Mbps up “Free Wi-Fi, although speed and bandwidth, is limited by our rural location.” We stayed at an Independent Hostel next to Derwentwater lake. It was only when we got there we realised how remote we actually were in terms of connectivity. There was: ● No mobile service available across the whole site indoors or outside. ● Wifi only available in 2 small rooms downstairs, and none of the 30+ bedrooms had Wifi at all. ● The bandwidth available was extremely limited (3.4 Mbps download, 8.2 Mbps upload). ● They even say on their website: “Free Wifi, although speed and bandwidth is limited by our rural location.” ● 150+ guests at the wedding. ● And approximately 40 kids attended too (including 2 of my own!) As you can imagine there were quite a few disappointed children. When their tablets couldn’t stream their favorite video streaming service!
Slide 15
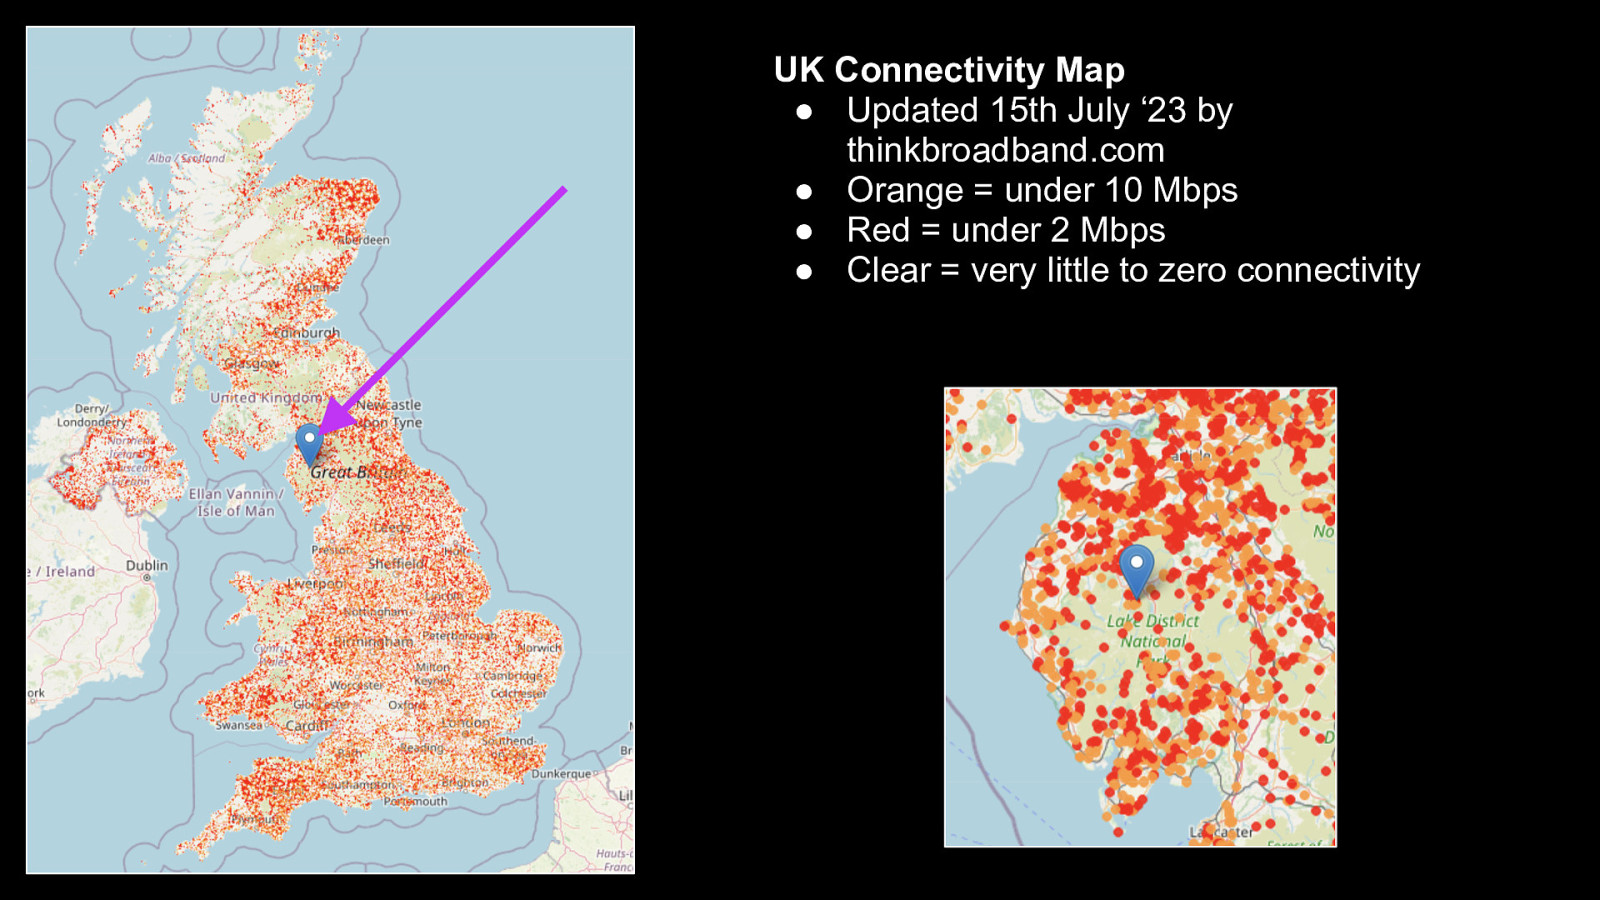
UK Connectivity Map ● Updated 15th July ‘23 by thinkbroadband.com ● Orange = under 10 Mbps ● Red = under 2 Mbps ● Clear = very little to zero connectivity As you can see from this map of connectivity in the UK updated in July, what we experienced while in the Lake District isn’t an isolated case! It happens everywhere across the country: For those wondering, the: ● Orange dots signify less than 10 Mbps available ● Red dots less than 2 Mbps available ● Lack of any colour means very little to zero connectivity available. Examining the specific area we stayed in (seen via the purple arrow), I’m amazed we had any connectivity at all!
Slide 16

Ofcom Connected Nations update— Spring 2023 In fact if we examine the 2023 Spring report from the UK’s communications regulator (Ofcom)…
Slide 17
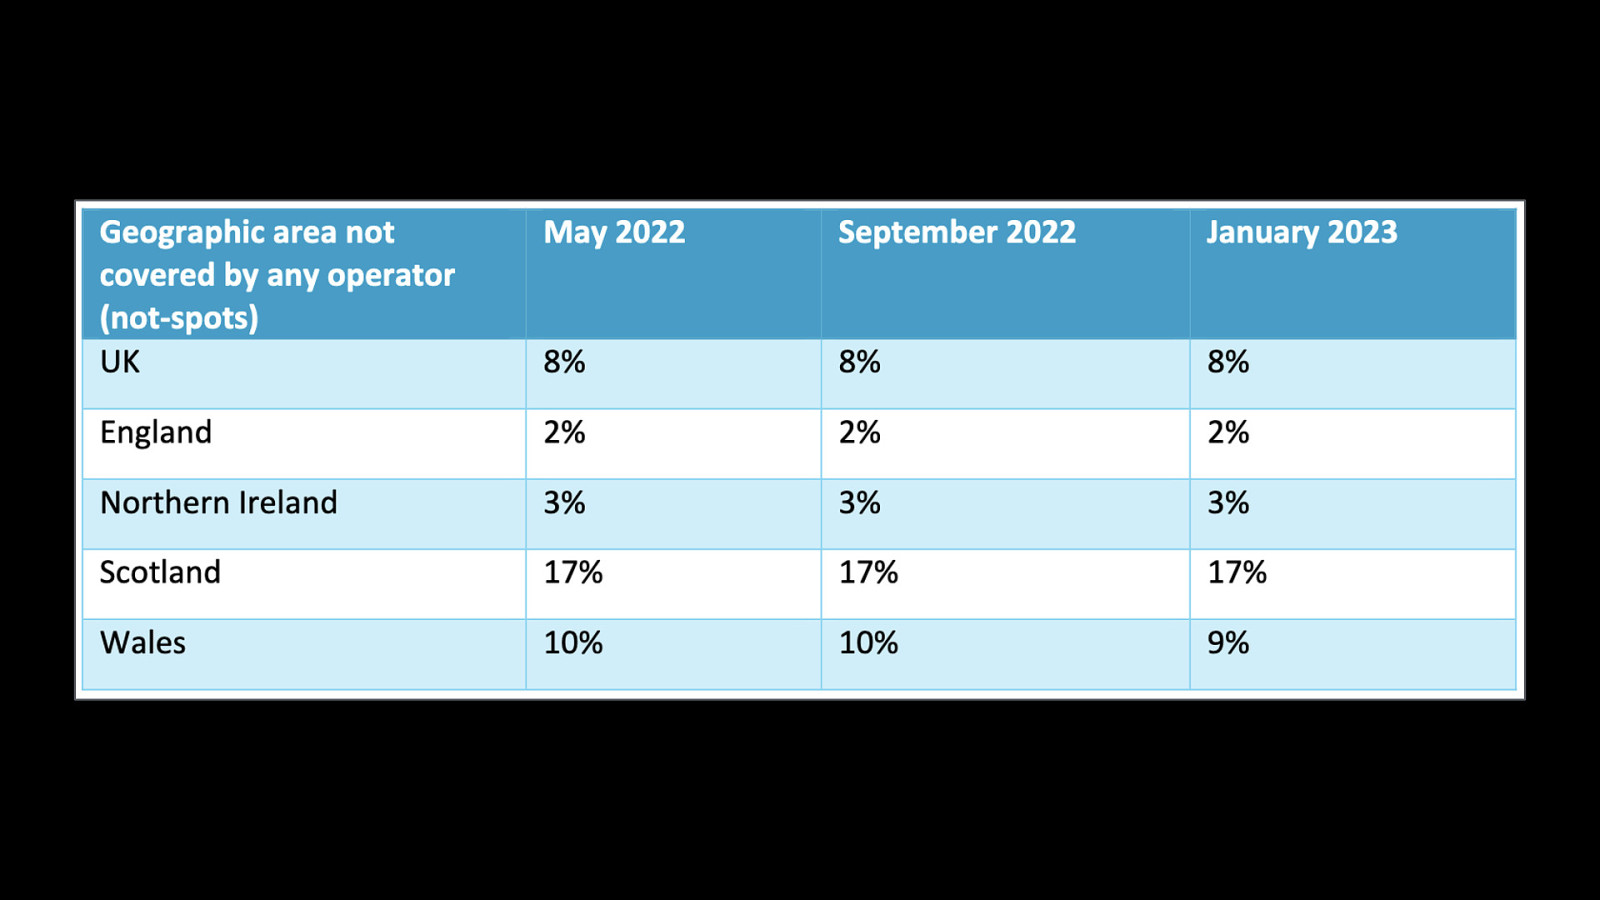
We can see that around 8% of the UK has no coverage by any of the mobile operators. The largest region being Scotland at 17% of the country being a “not-spot” for mobile data.
Slide 18

UK Connectivity Map ● Updated 15th July ‘23 by thinkbroadband.com ● Orange = under 10 Mbps ● Red = under 2 Mbps ● Clear = very little to zero connectivity As can be seen by looking at the map again. Yes, these are rural areas, but they aren’t devoid of people. They are full of everyday people. Trying to apply for passports, register a death or file their tax returns! 17% of Scotland is a huge area, with hundreds of thousands of people living in it. For these people any mobile or broadband connection is likely to be precious. They most likely don’t care about huge amounts of interactivity on a website. They need a site to load quickly and allow them to get from A to B with as little hassle as possible!
Slide 19
The Communications and Digital Committee report—29th June 2023 The UK government is aware of the issue as there was a report from the UK Parliament published in June.
Slide 20
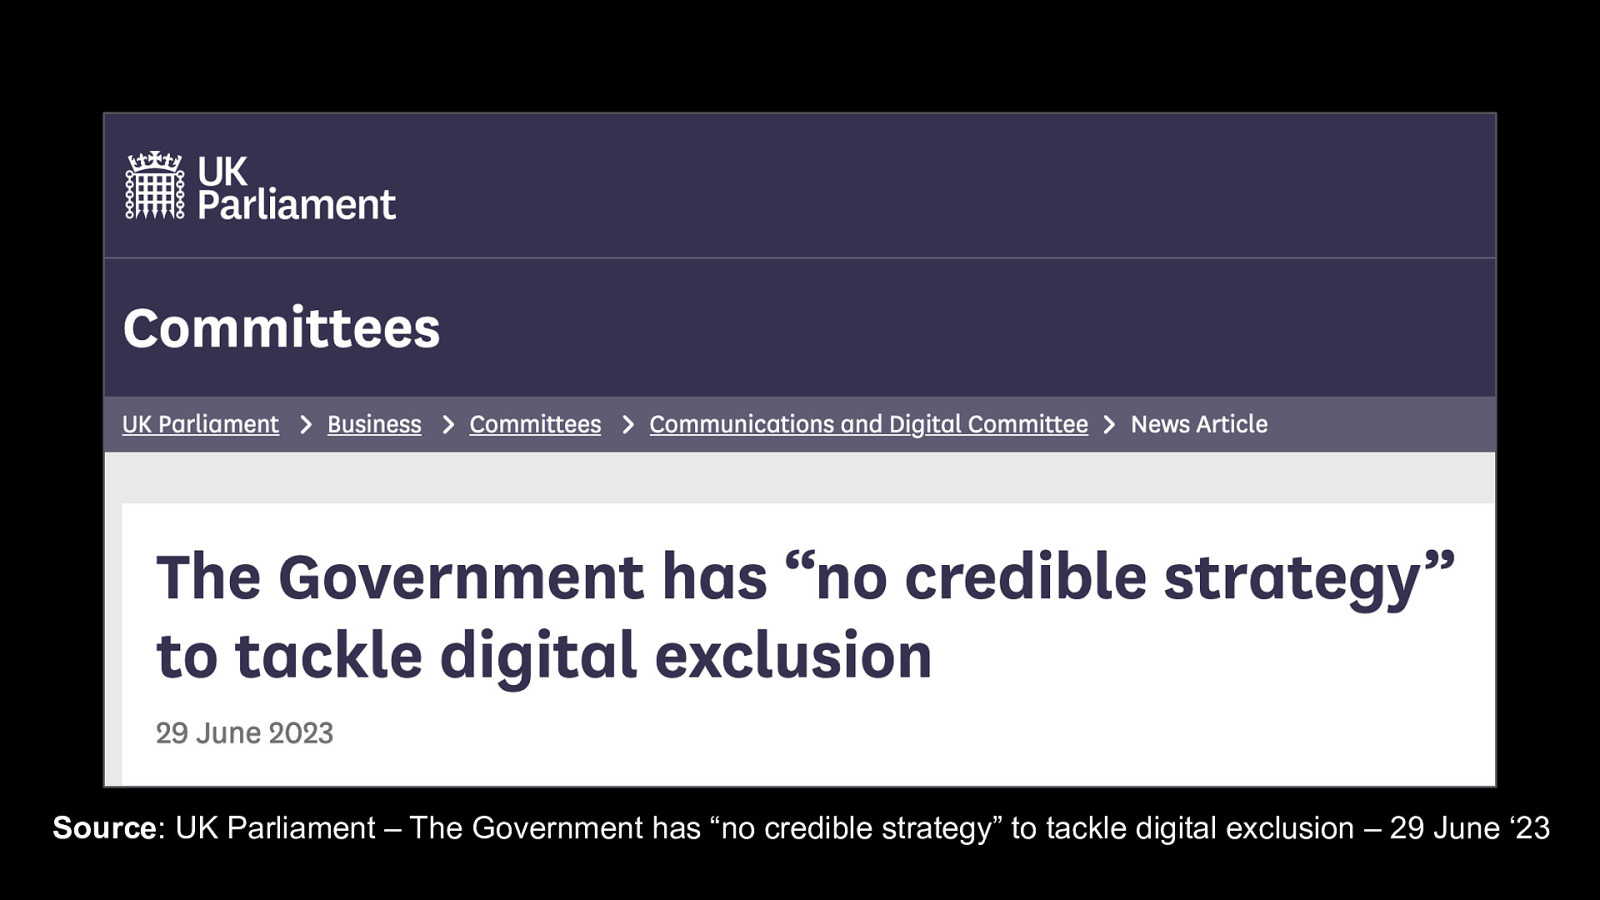
Source: UK Parliament – The Government has “no credible strategy” to tackle digital exclusion – 29 June ‘23 The Report is called: “The Government has ‘no credible strategy’ to tackle digital exclusion”.
Slide 21
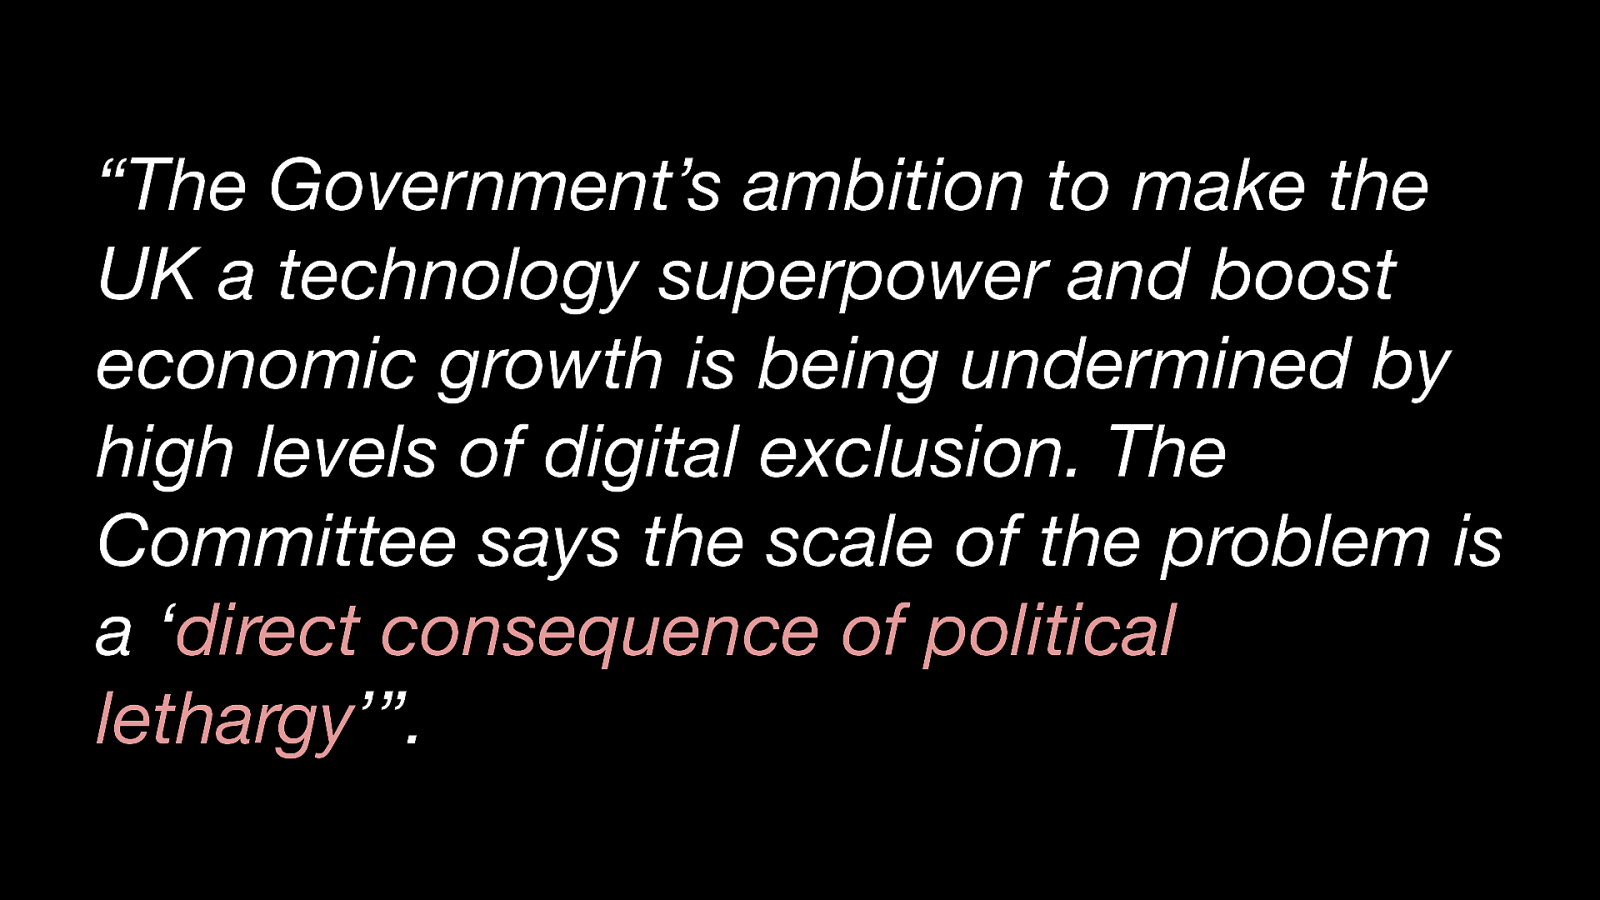
“The Government’s ambition to make the UK a technology superpower and boost economic growth is being undermined by high levels of digital exclusion. The Committee says the scale of the problem is a ‘direct consequence of political lethargy’”. The key findings of the report say: “The Government’s ambition to make the UK a technology superpower and boost economic growth is being undermined by high levels of digital exclusion. The Committee says the scale of the problem is a “direct consequence of political lethargy”.” Some of the figures that come from the report make for a pretty disheartening read…
Slide 22
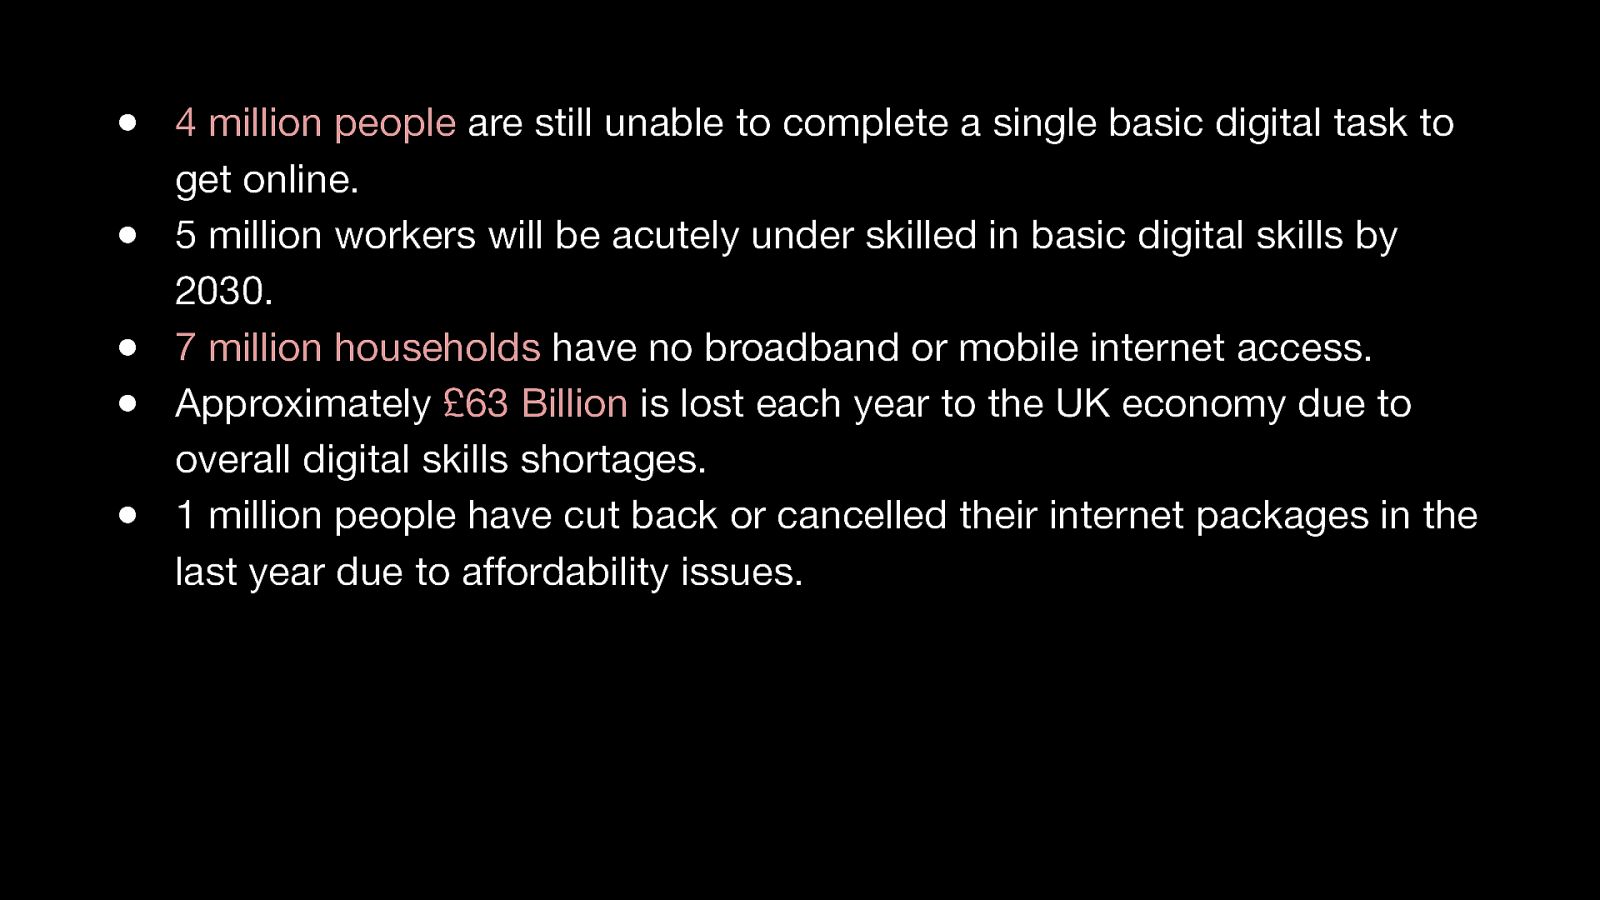
● 4 million people are still unable to complete a single basic digital task to get online. ● 5 million workers will be acutely under skilled in basic digital skills by 2030. ● 7 million households have no broadband or mobile internet access. ● Approximately £63 Billion is lost each year to the UK economy due to overall digital skills shortages. ● 1 million people have cut back or cancelled their internet packages in the last year due to affordability issues. …these include: ● 7 million households in the UK have no broadband OR mobile internet access ● 4 million people are still unable to complete a single basic digital task to get online. Unfortunately, the problem has only got worse over the past few years due to the cost of living crisis. As people are cancelling their monthly internet packages to save money. This is costing the UK economy approximately £63 Billion pounds every year because the country has a digital skills shortage.
Slide 23
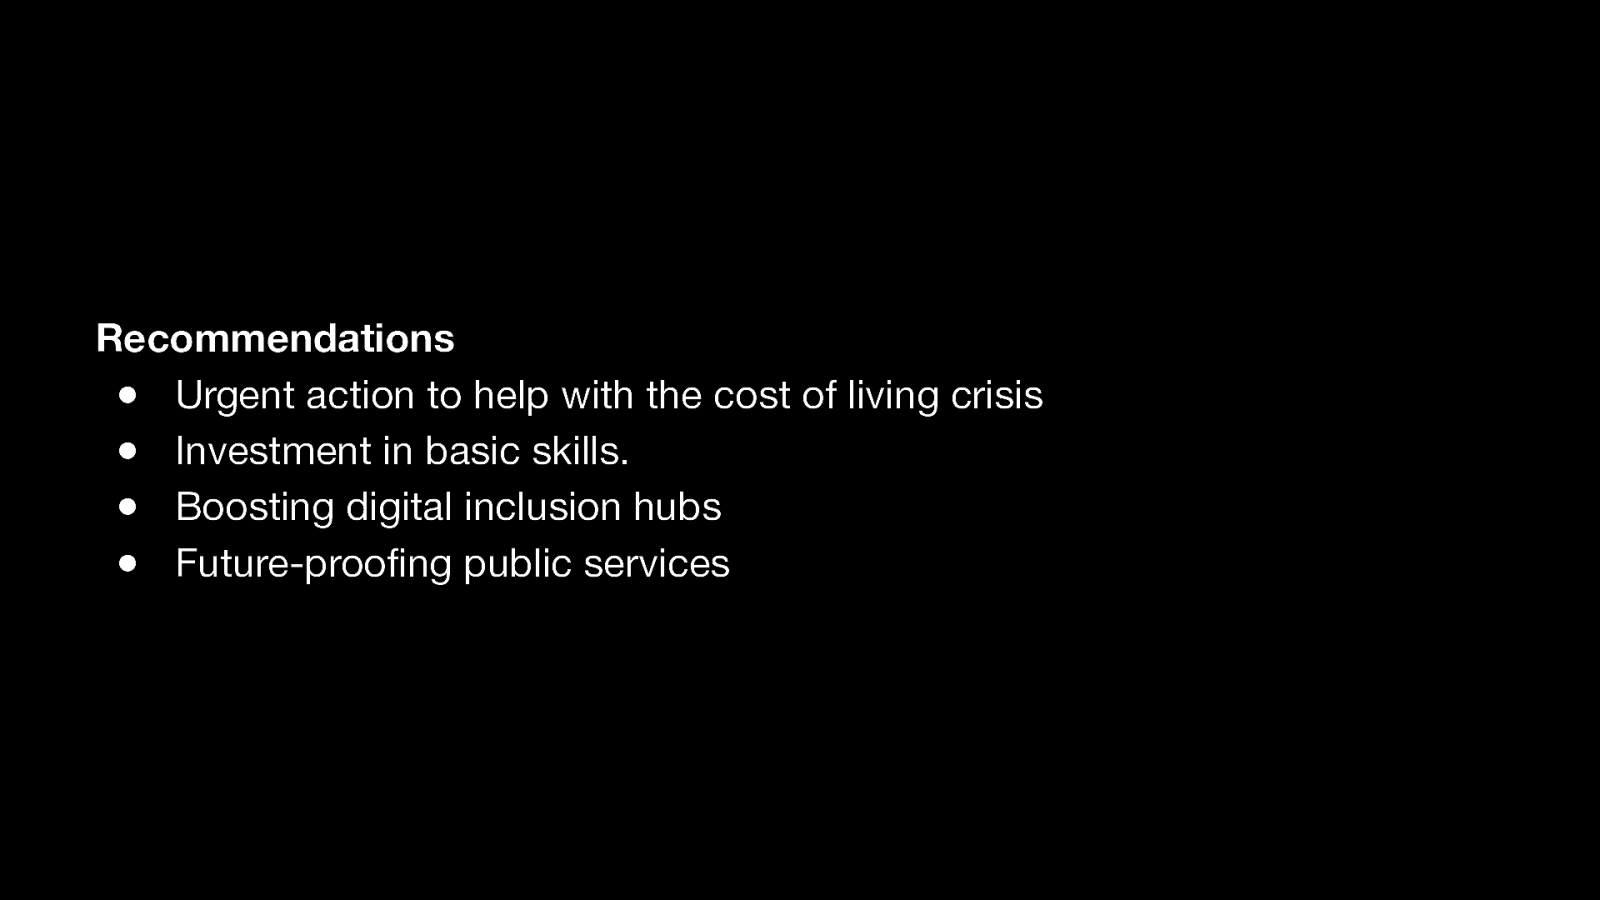
Recommendations ● Urgent action to help with the cost of living crisis ● Investment in basic skills. ● Boosting digital inclusion hubs ● Future-proofing public services Among some recommendations the report calls for is: ● urgent action to help with the cost of living crisis. ● And a big investment in basic digital skills, as the most basic digital skills are now as important as maths and literacy. An interesting note from the report, it specifically says: ”The focus should be on basic skills, not coding.”
Slide 24
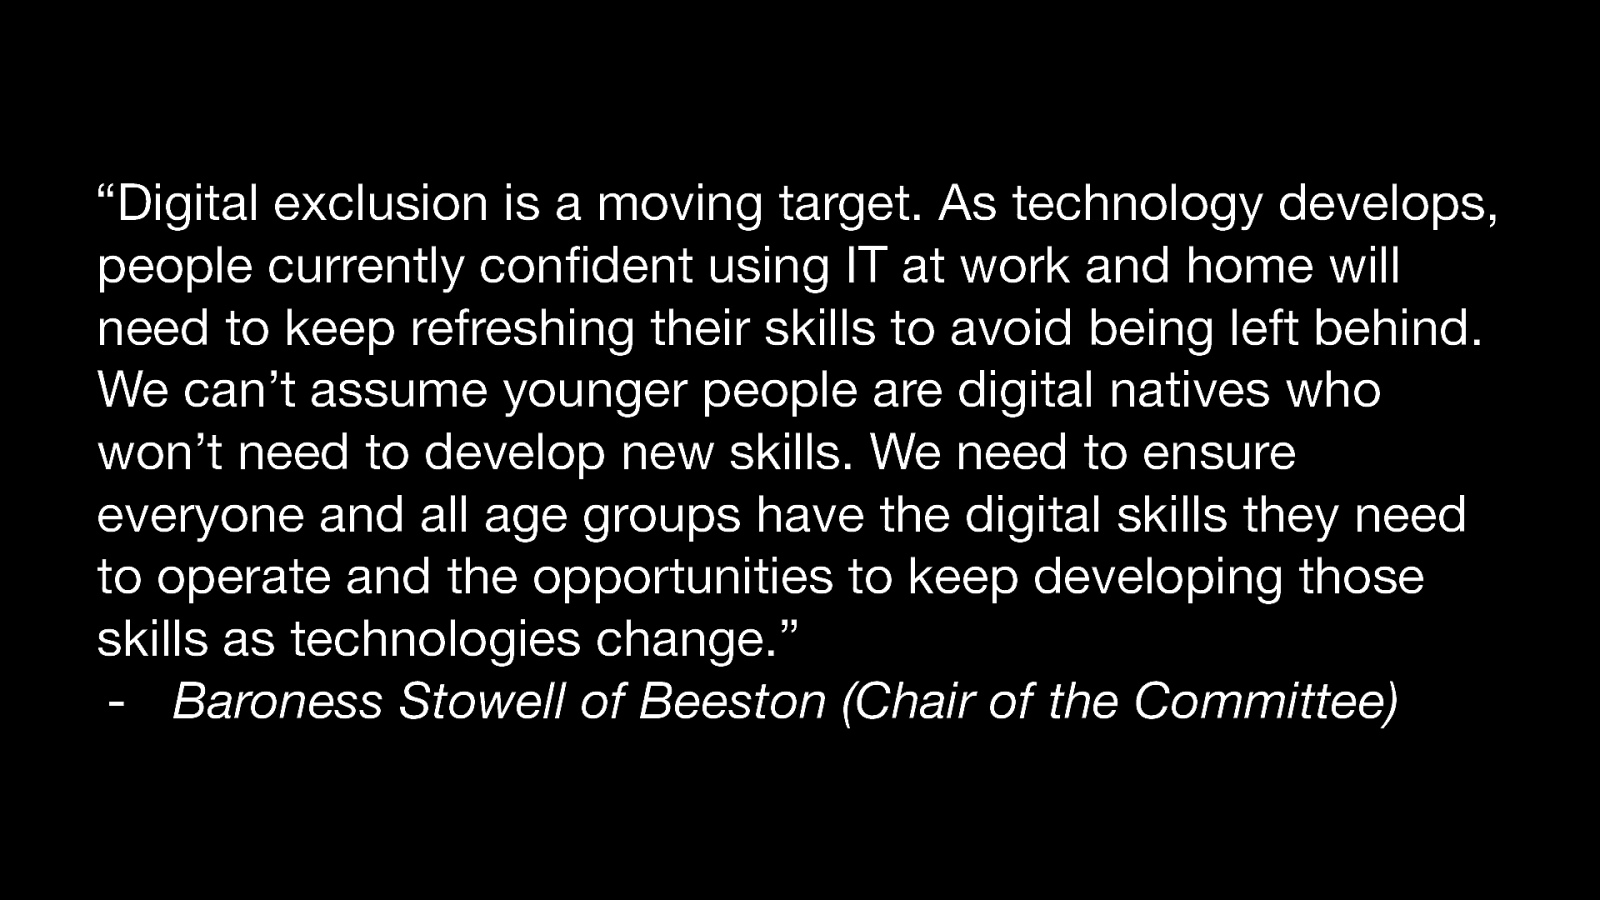
“Digital exclusion is a moving target. As technology develops, people currently confident using IT at work and home will need to keep refreshing their skills to avoid being left behind. We can’t assume younger people are digital natives who won’t need to develop new skills. We need to ensure everyone and all age groups have the digital skills they need to operate and the opportunities to keep developing those skills as technologies change.” - Baroness Stowell of Beeston (Chair of the Committee) The Chair of the Committee baroness Stowell of Beeston, hits the nail on the head with her summary comments, she says: ● Digital exclusion is a moving target. As technology develops, people currently confident using IT at work and home will need to keep refreshing their skills to avoid being left behind. ● We need to ensure everyone and all age groups have the digital skills they need to operate and the opportunities to keep developing those skills as technologies change. As we all know technology does move fast and is always evolving. And she also comes back to the point I mentioned earlier that this isn’t a young vs old demographic issue. All age groups must be involved in this ongoing digital upskilling.
Slide 25

Responsibility? So whose responsibility is it for this Digital upskilling, to help bridge the digital divide? [DRINK]
Slide 26
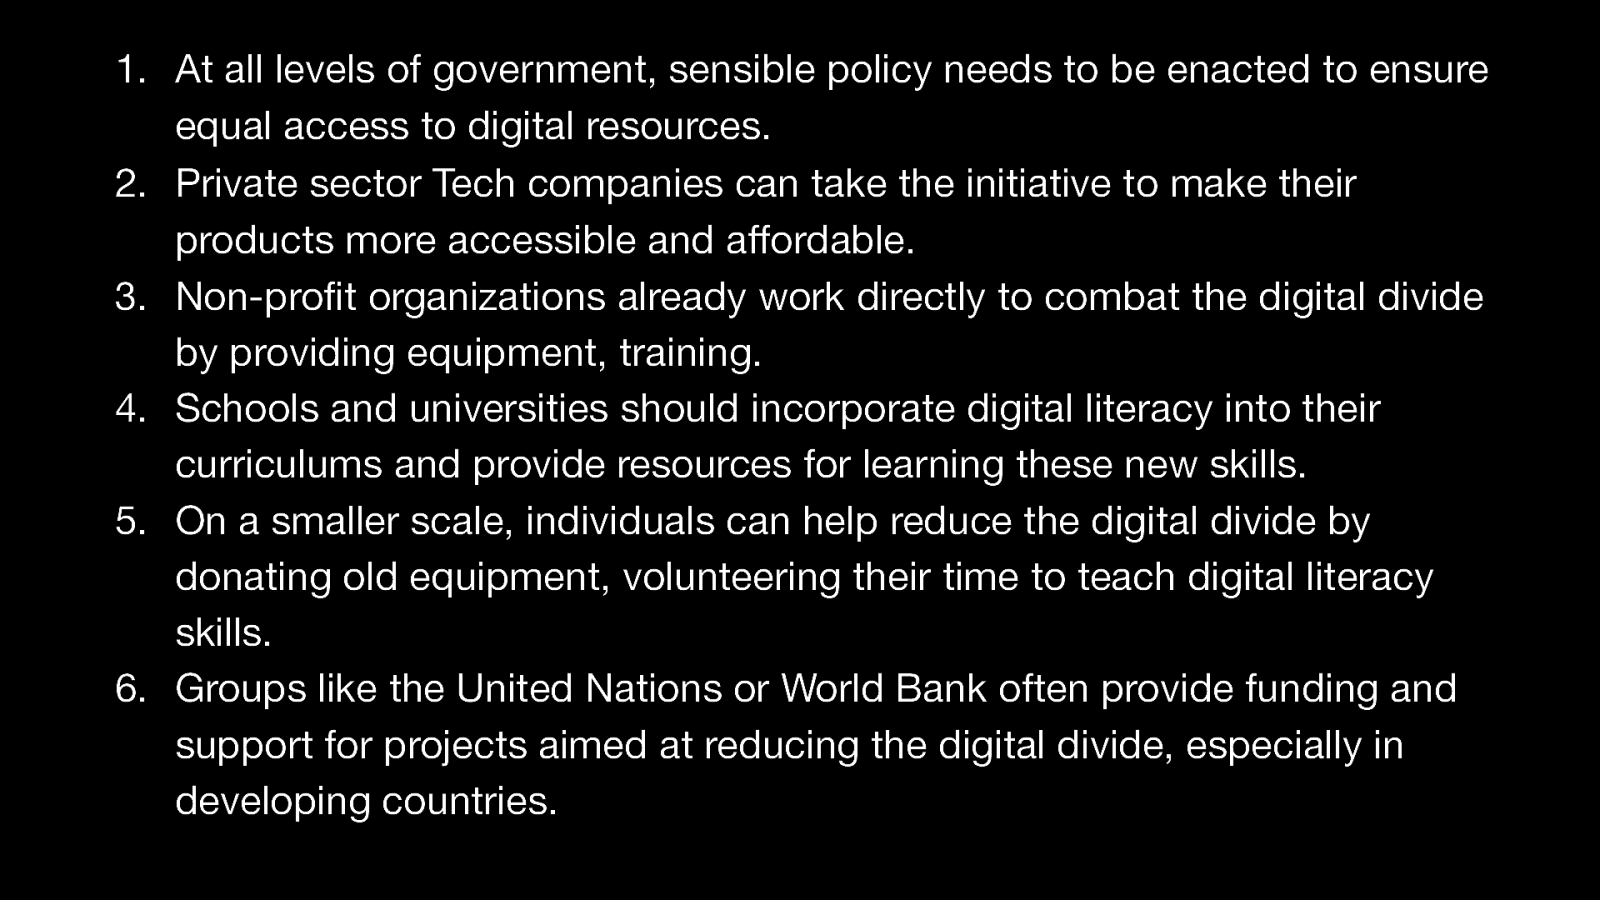
- At all levels of government, sensible policy needs to be enacted to ensure equal access to digital resources. 2. Private sector Tech companies can take the initiative to make their products more accessible and affordable. 3. Non-profit organizations already work directly to combat the digital divide by providing equipment, training. 4. Schools and universities should incorporate digital literacy into their curriculums and provide resources for learning these new skills. 5. On a smaller scale, individuals can help reduce the digital divide by donating old equipment, volunteering their time to teach digital literacy skills. 6. Groups like the United Nations or World Bank often provide funding and support for projects aimed at reducing the digital divide, especially in developing countries. There are 6 key sectors where the responsibility for reducing the digital divide could fall: 1. First it falls on governments to enact sensible policies to ensure equal access for all. 2. Private sector companies have a role to play too, they can make their products more accessible and affordable 3. Non-profit organisations are already working in this space to provide people with equipment, training and internet access. 4. Schools and Universities should incorporate digital literacy into their curriculums. This is particularly important for rural and low-income areas. As students may not have access to these resources at home. 5. Individuals can help bridge the digital divide by donating old equipment and volunteering to teach digital literacy skills. 6. Global organisations like the United Nations and World Bank already provide funding and support for projects especially in developing countries. All these entities have a role to play, and it’s only through a combined effort that the digital divide can be addressed. The digital divide isn’t only about internet access and devices, it’s a multifaceted issue that will take a lot of coordination and resources to “solve”, and it’s going to take a decades, so best start now!
Slide 27

As the creepy Wonka meme says: what’s in it for me? Why would I as an individual or an organisation do this?
Slide 28

UK Connectivity Map ● Updated 15th July ‘23 by thinkbroadband.com ● Orange = under 10 Mbps ● Red = under 2 Mbps ● Clear = very little to zero connectivity If we go back to our depressing map of the connectivity in the UK. We see 7 million households have no broadband OR mobile internet access. And as I mentioned this problem is costing the economy approximately £63 Billion pounds every year. If you are: ● a business that’s a lot of potential customers! ● a charity a lot of potential donations! ● the government, that’s a lot of the population excluded from your services. ○ And remember they all paying some form of tax, they have as much a right to access as everyone does. So let’s see, is this only a UK issue?
Slide 29
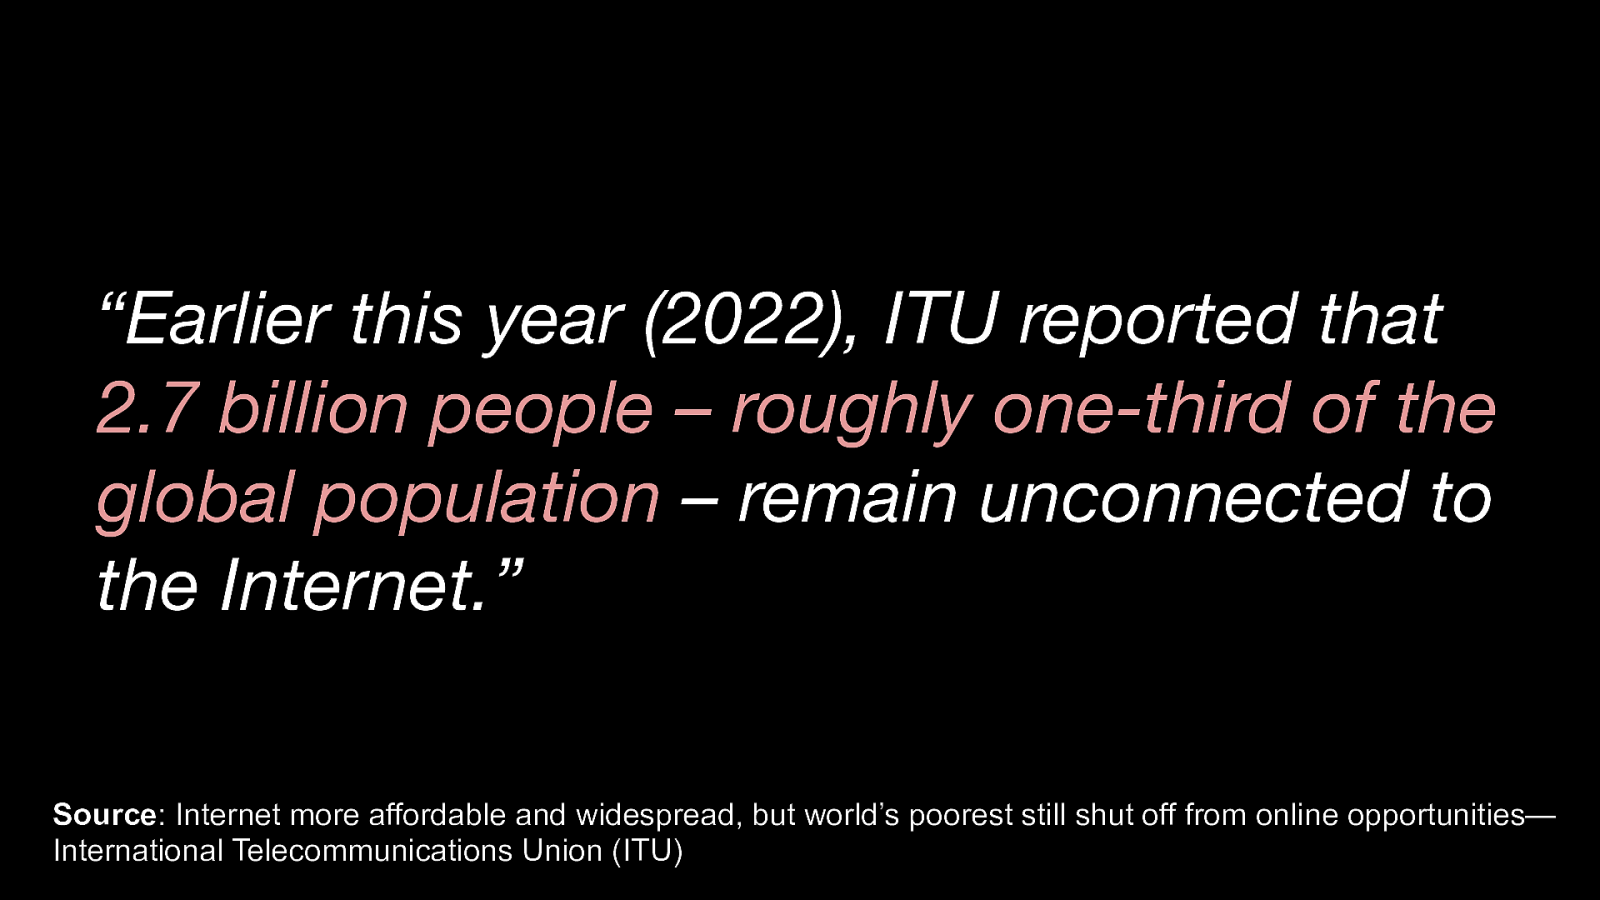
“Earlier this year (2022), ITU reported that 2.7 billion people – roughly one-third of the global population – remain unconnected to the Internet.” Source: Internet more affordable and widespread, but world’s poorest still shut off from online opportunities— International Telecommunications Union (ITU) Unfortunately, no. This is a global issue with a staggering 2.7 billion people or one-third of the global population still remain unconnected to the internet. This is according to the International Telecommunications Union in 2022.
Slide 30
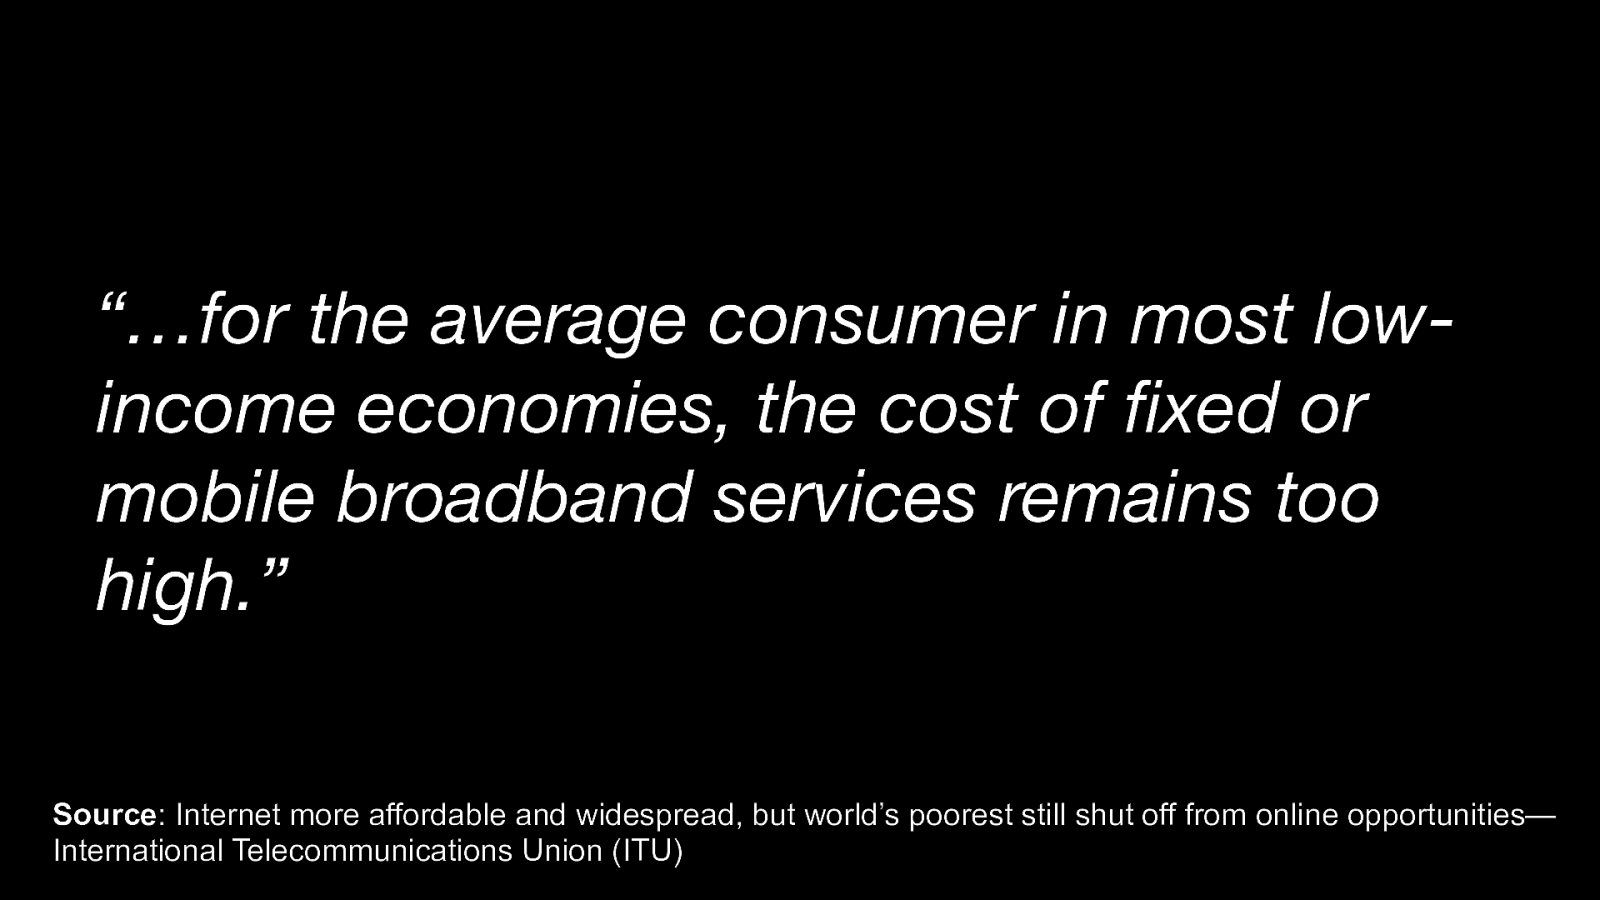
“…for the average consumer in most lowincome economies, the cost of fixed or mobile broadband services remains too high.” Source: Internet more affordable and widespread, but world’s poorest still shut off from online opportunities— International Telecommunications Union (ITU) The ITU statistics say, the cost of mobile and broadband services has dropped in recent years. But it still remains too high for an average customer in a low-income economy.
Slide 31
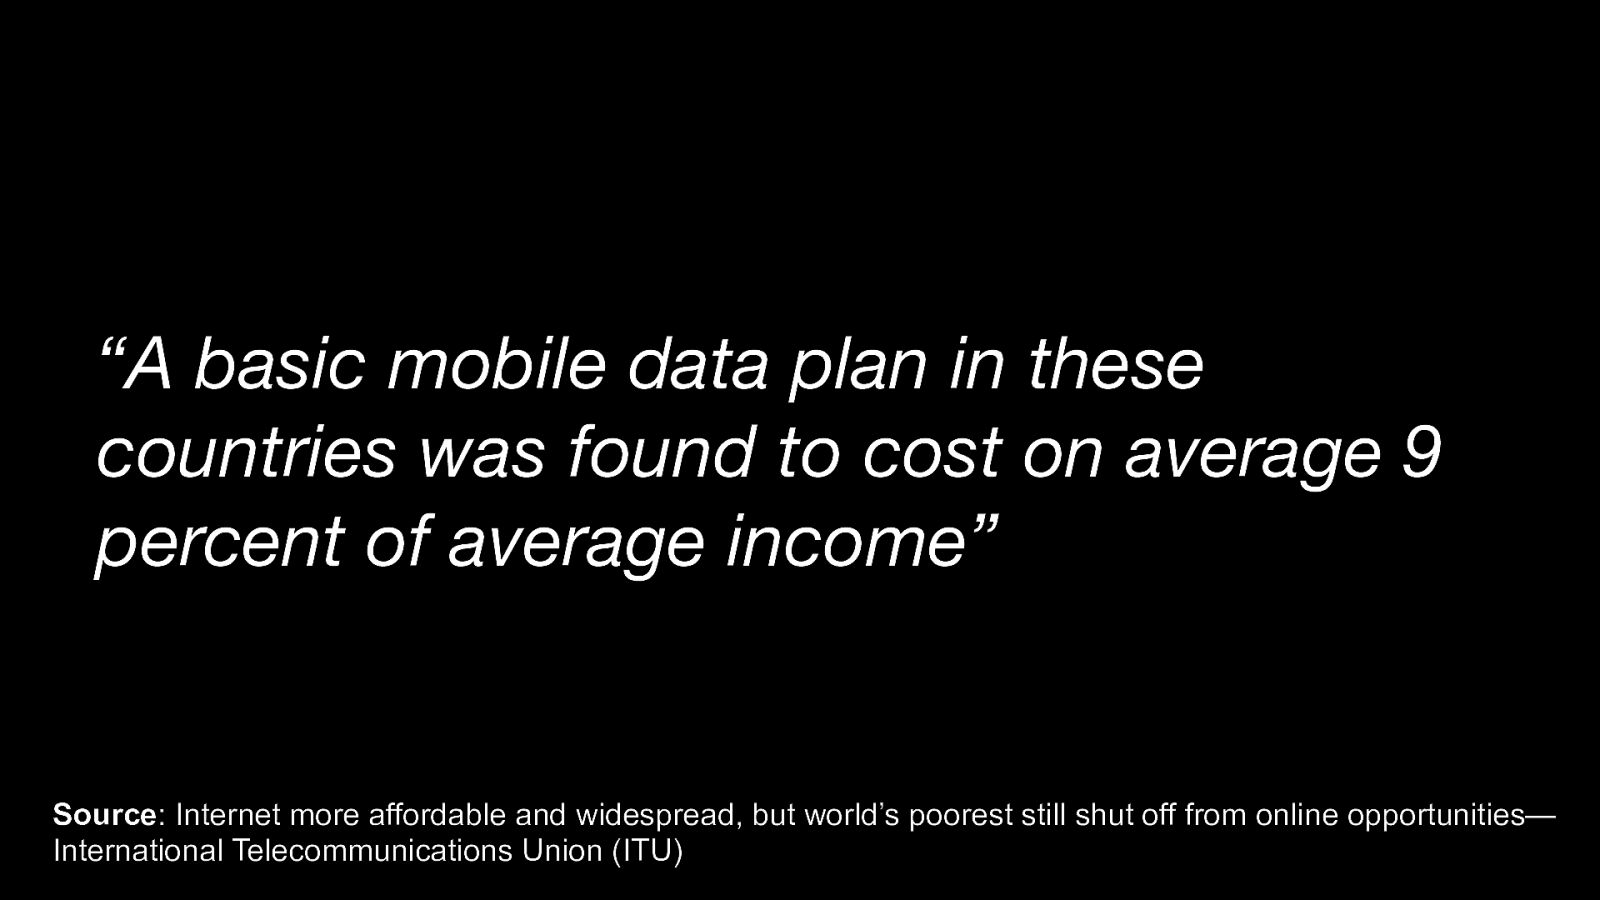
“A basic mobile data plan in these countries was found to cost on average 9 percent of average income” Source: Internet more affordable and widespread, but world’s poorest still shut off from online opportunities— International Telecommunications Union (ITU) A basic mobile data plan in these low-income economies costs approximately 9% of the average income! People living in this situation are literally choosing between food and housing, or connectivity. Under these circumstances connectivity is always going to be the lowest priority.
Slide 32

So coming back to “what’s in it for me?”
Slide 33
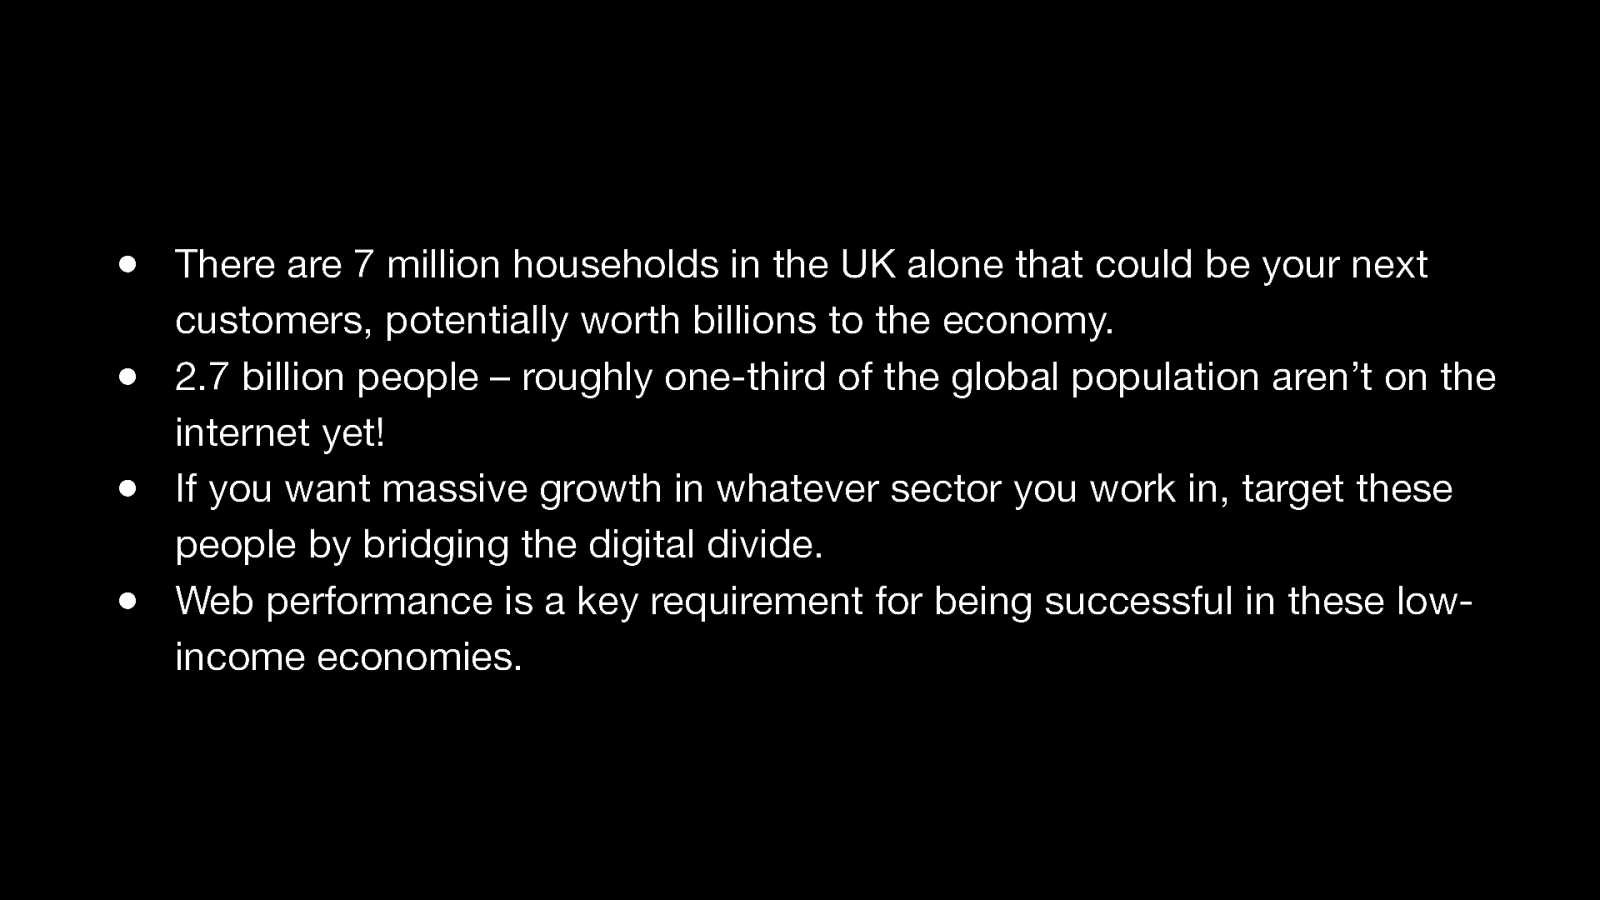
● There are 7 million households in the UK alone that could be your next customers, potentially worth billions to the economy. ● 2.7 billion people – roughly one-third of the global population aren’t on the internet yet! ● If you want massive growth in whatever sector you work in, target these people by bridging the digital divide. ● Web performance is a key requirement for being successful in these lowincome economies. Well… There are 7 million households in the UK alone that could be your next customers, worth billions to the economy. And magnitudes greater than that is the 2.7 billion people. Roughly one-third of the global population are yet to connect to the internet, so target these low-income economies. Web performance is vital to being successful in these low-income economies.
Slide 34
“A rising tide lifts all boats” - John F. Kennedy As the memorable phrase from JFK goes: “A rising tide lifts all boats” So, if you make your sites fast for a low-income economy, then it will be fast everywhere, and for everyone.
Slide 35

- Mobile-First Design Number 2: Mobile-first Design. Given that a large proportion of users in countries on the “other side” of the digital divide access the internet through mobile devices…. [DRINK]
Slide 36
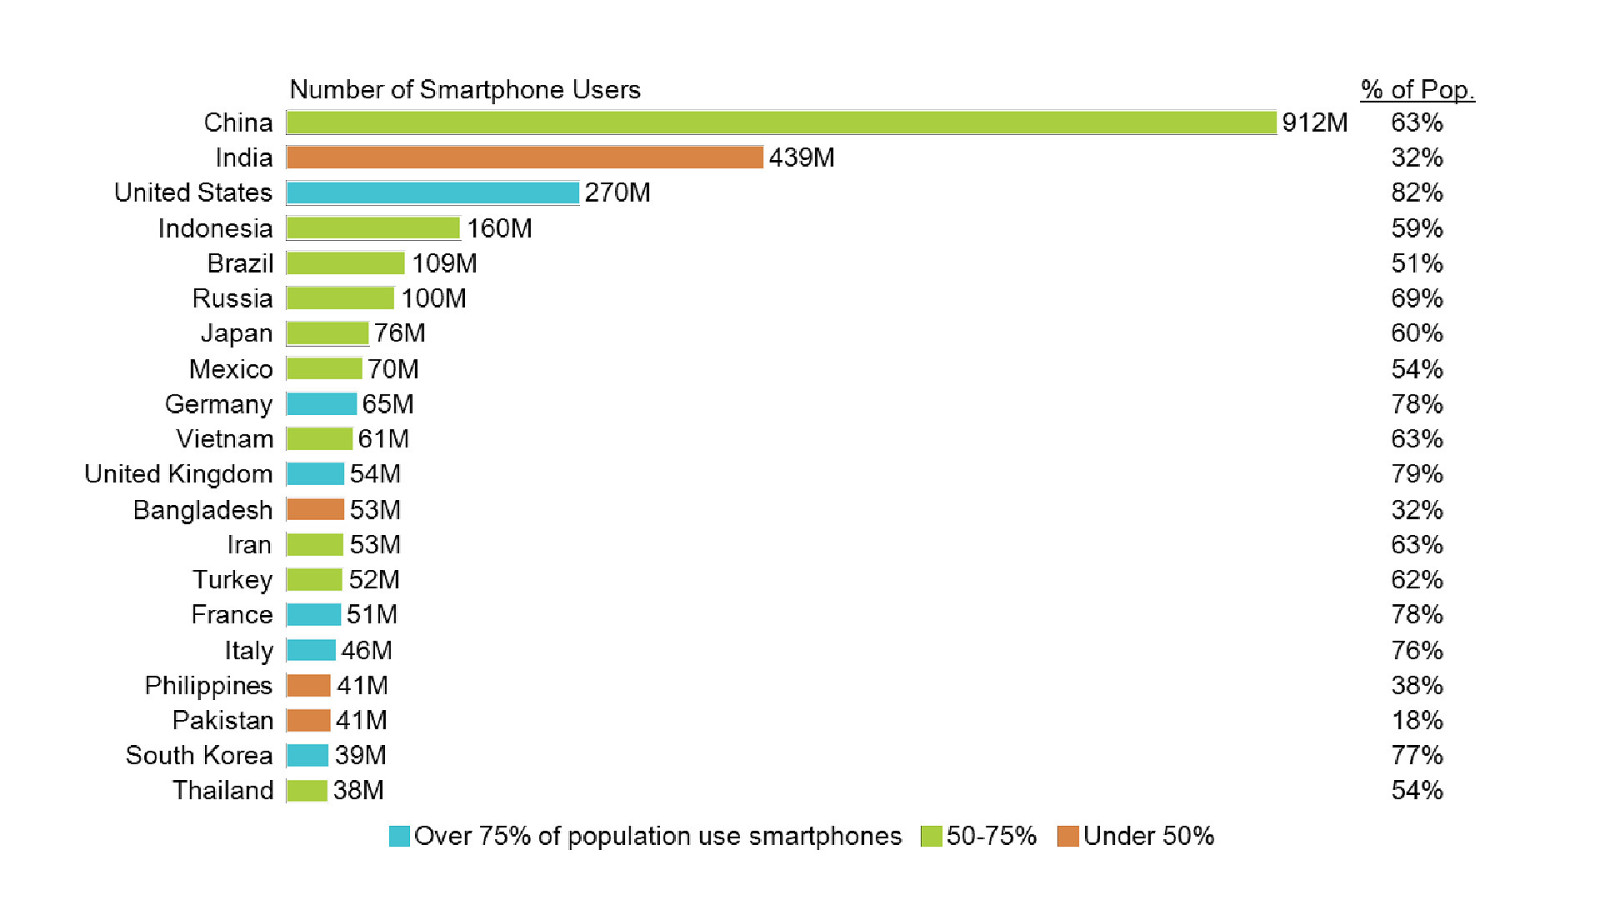
…as seen on this graph in green where 50 - 75% of the population use smartphones, Keerthana’s (Keith-ana) fantastic talk touched on this yesterday! Designing websites with a mobile-first approach ensures that these users have a the best user experience they can. Given any device limitations they may have. Responsive web design allows a website to adapt to the screen size, and capabilities of the device accessing it. Which is key for users with lower-end devices, or slower network connections.
Slide 37
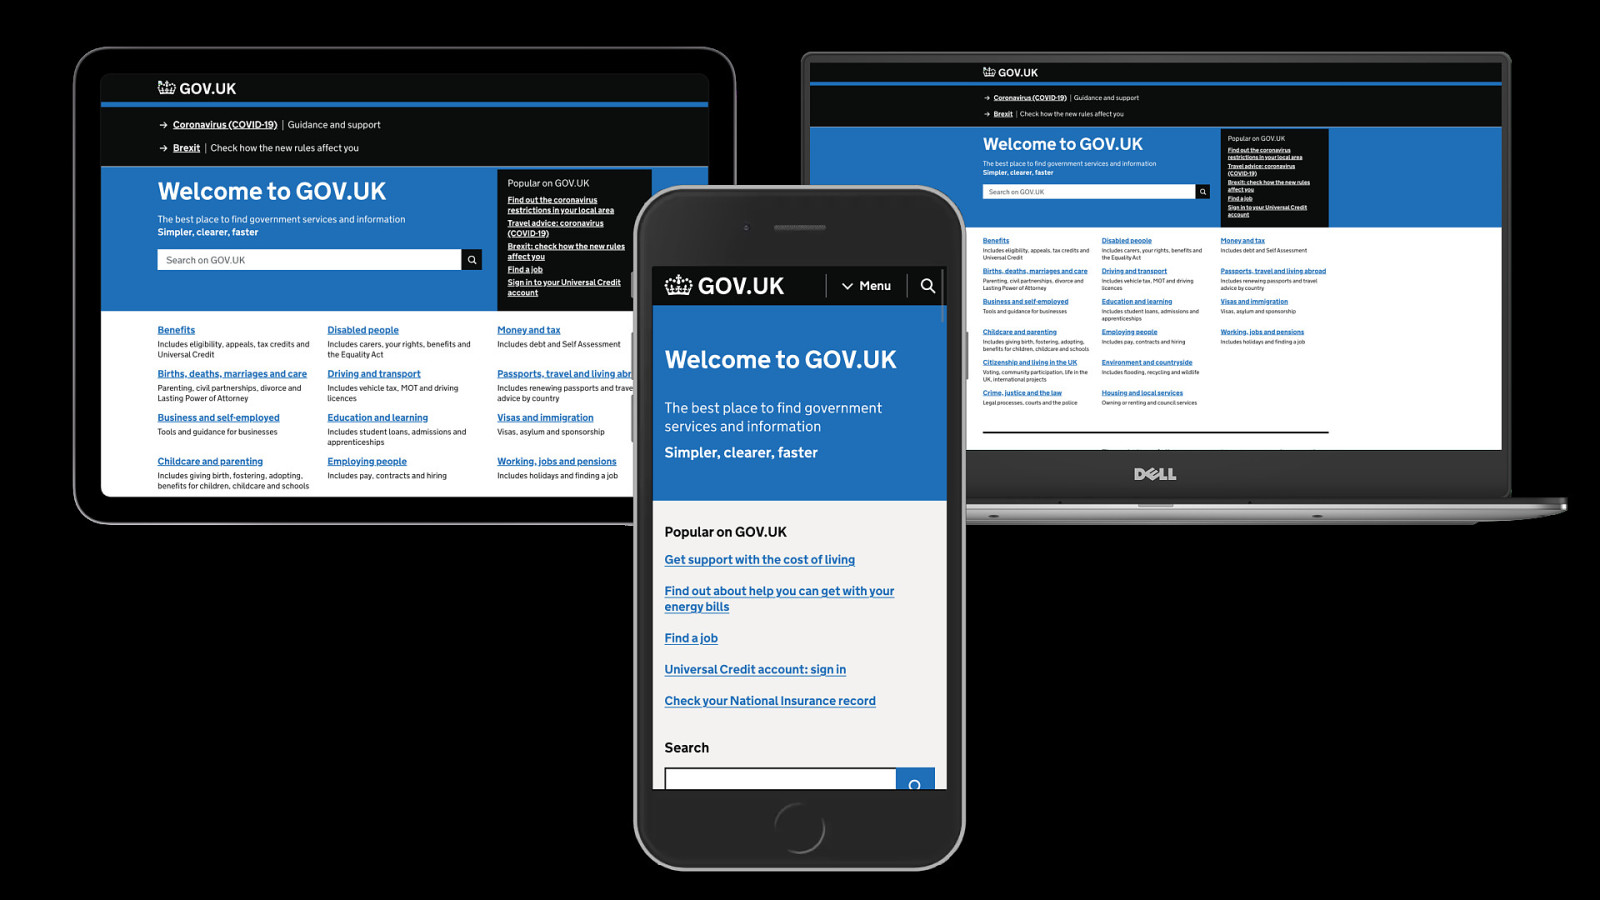
Here I will focus on UK data from GOV.UK. For those of you not from the UK, here’s a brief explanation of what it is. GOV.UK is the website for the UK government. It’s the best place to find policy, announcements, information about the government, and guidance for citizens. Since 2012 it has replaced 1,884 government websites with one, to become the home of all central government’s online content and services. You can see what GOV.UK looks like on the slide. This is on an iPad, iPhone, and a Dell Laptop.
Slide 38
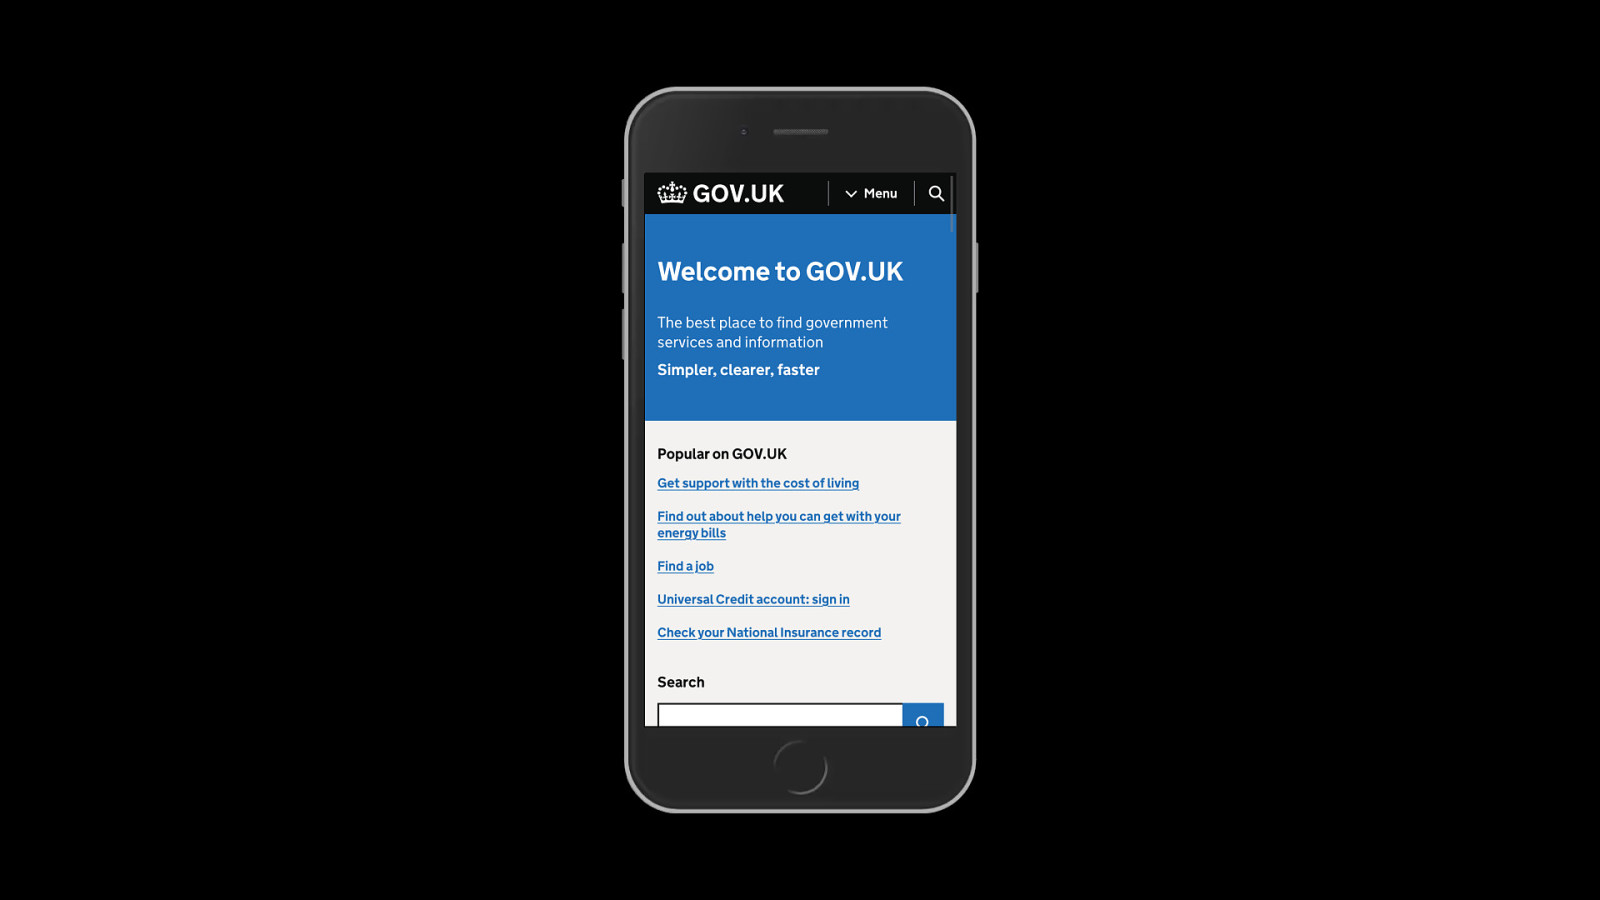
You will see the site on the slide the site is built using mobile-first design principles. The design is clean and simple and lends itself well to being a mobile site. It was a brave decision by the GDS design team to use a mobile-first approach back in 2012 when it was first launched.
Slide 39
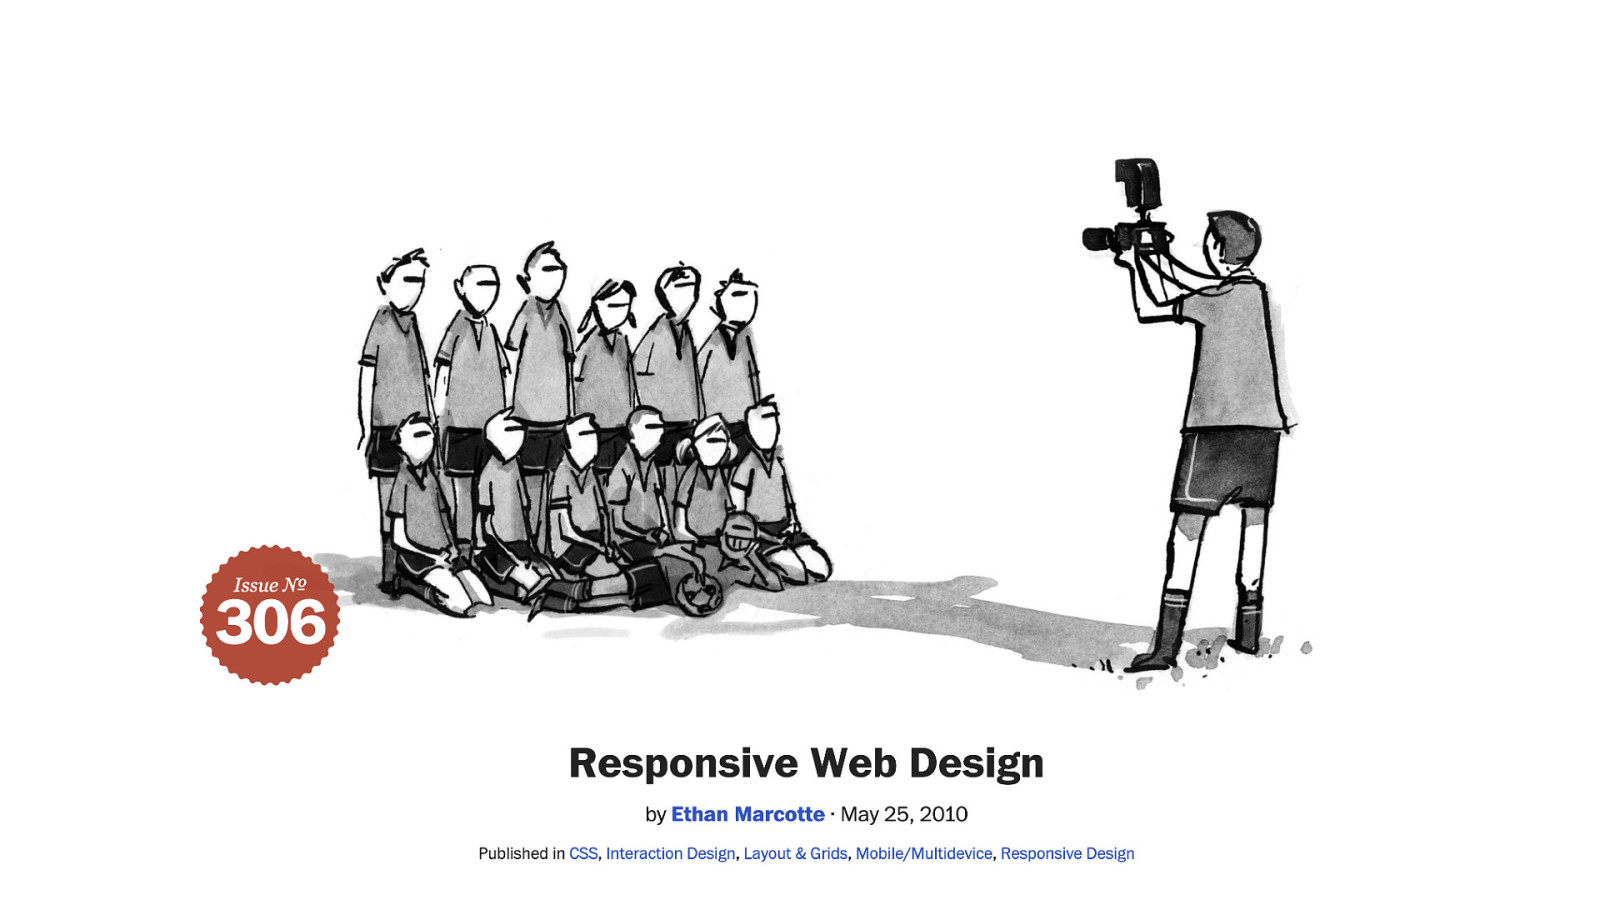
Considering the now famous A List Apart article “Responsive Web Design” by Ethan Marcotte, had “only just” been released in mid-2010. And it wasn’t until 2013 that responsive design took the internet by storm.
Slide 40
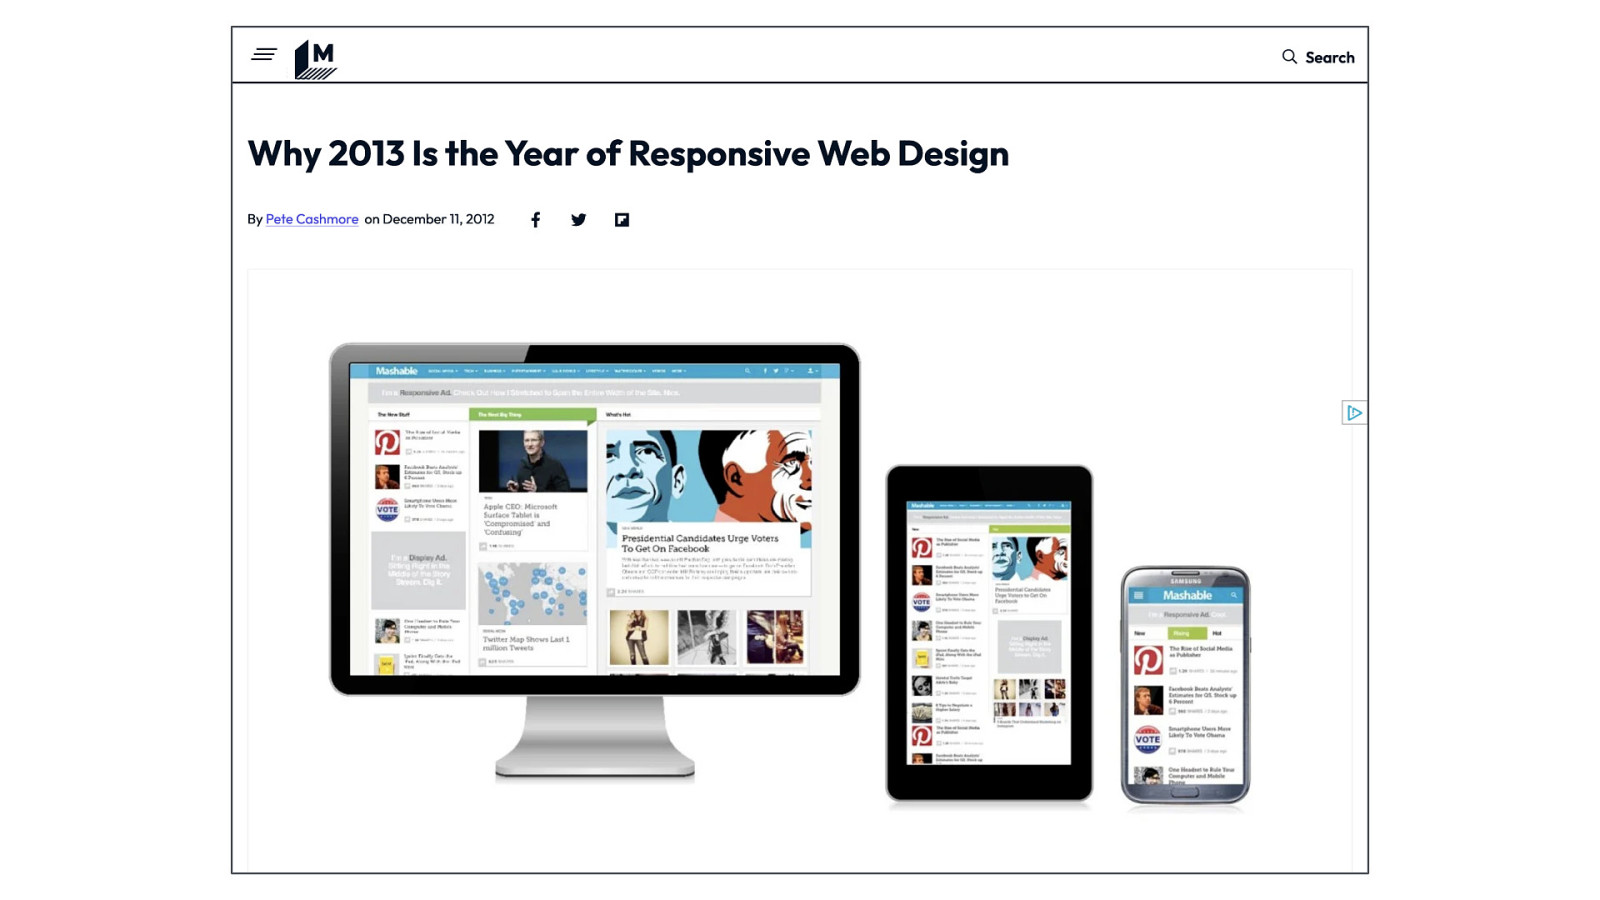
In fact, Mashable actually called 2013 the Year of Responsive Web Design. To back up this claim they released a responsive version of their website for the “The Post-PC Era”, as they called it.
Slide 41
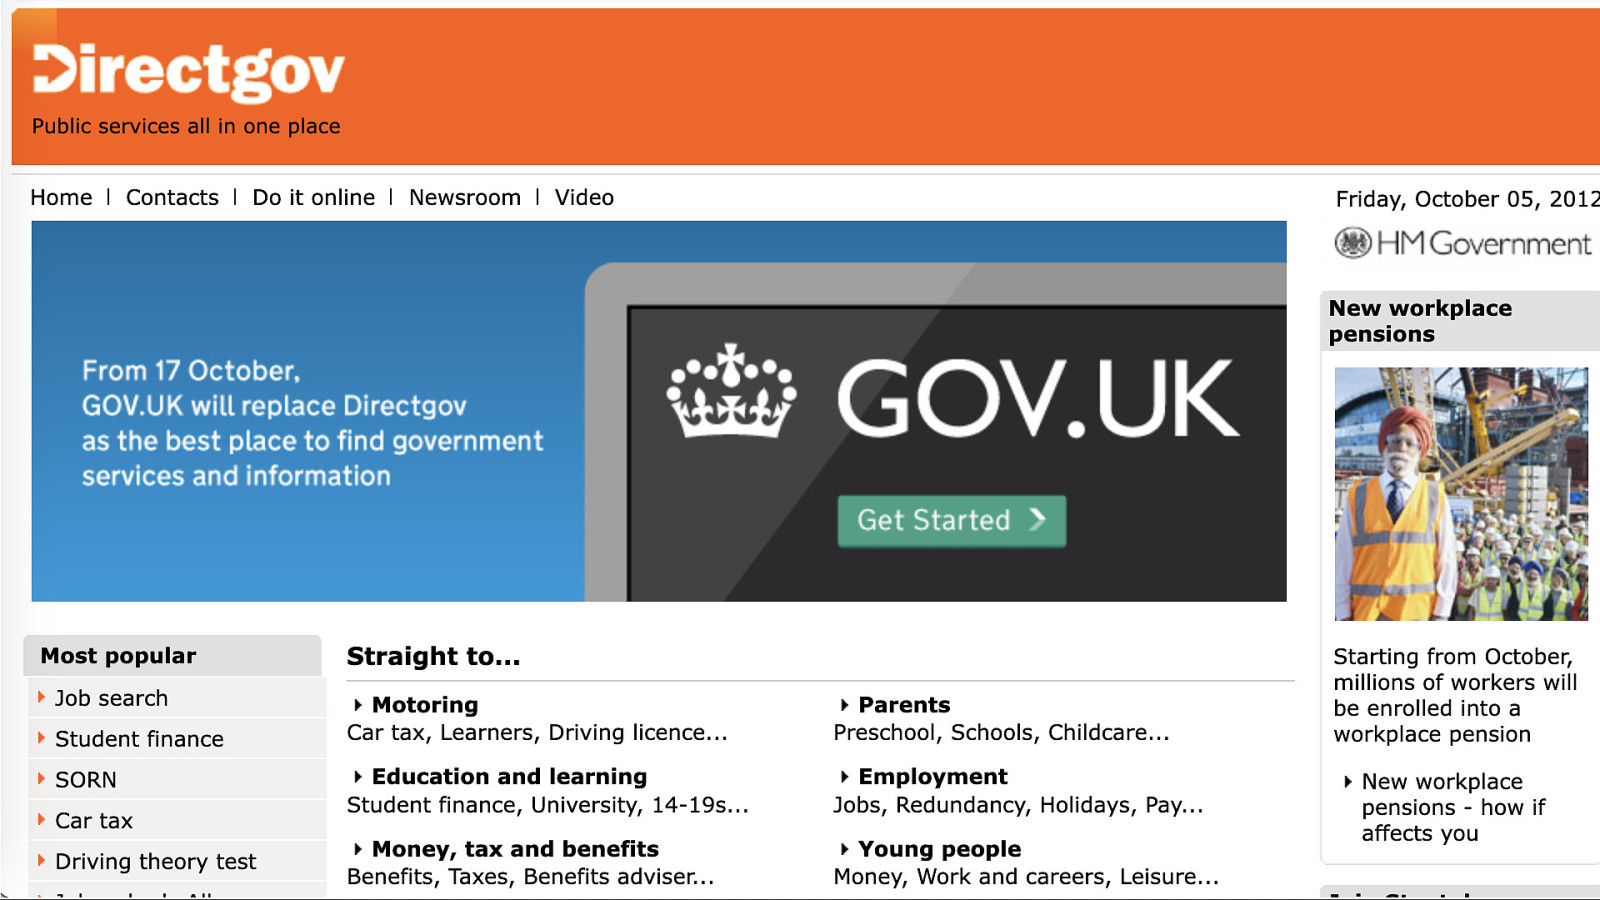
Back to the topic of GOV.UK, this is what the site looked like before! It wasn’t exactly mobile-friendly and many would say very user friendly either! And remember this was (and still is) a fully taxpayer funded service!
Slide 42
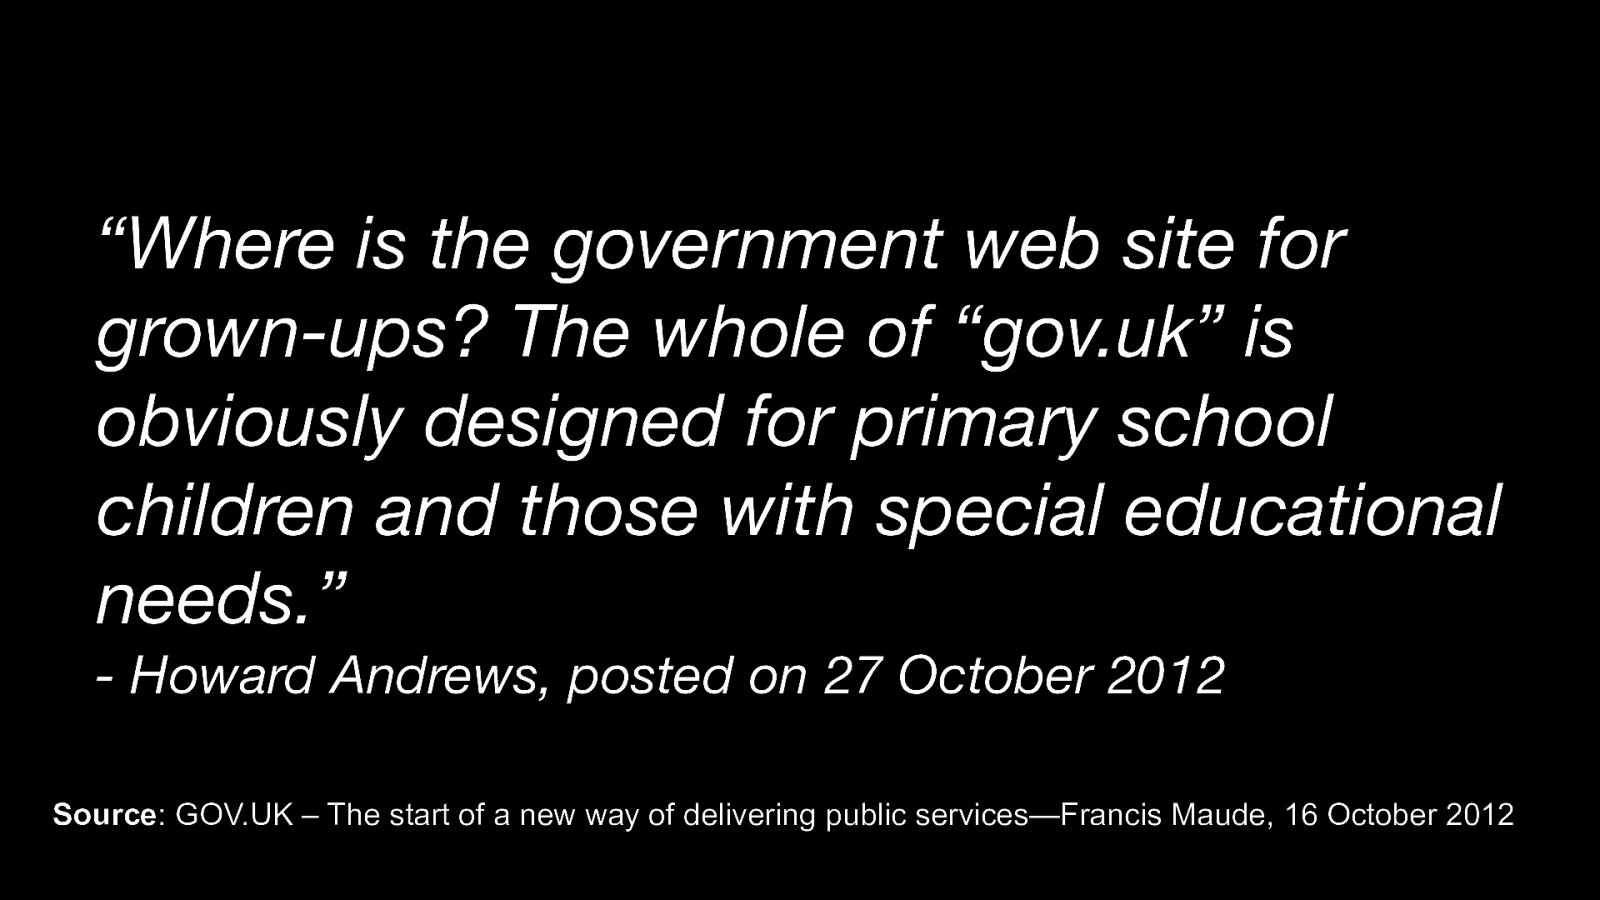
“Where is the government web site for grown-ups? The whole of “gov.uk” is obviously designed for primary school children and those with special educational needs.” - Howard Andrews, posted on 27 October 2012 Source: GOV.UK – The start of a new way of delivering public services—Francis Maude, 16 October 2012 The new design was quite controversial at the time. There were some angry members of the public leaving comments on the GDS blog post announcing the launch. Here a random member of the public (Howard Andrews) comments: “Where is the government website for grown-ups?” “The whole of ‘gov.uk’ is obviously designed for primary school children and those with special educational needs.” Seems pretty harsh Howard! I interested to know if he still feels the same after 11-years?
Slide 43
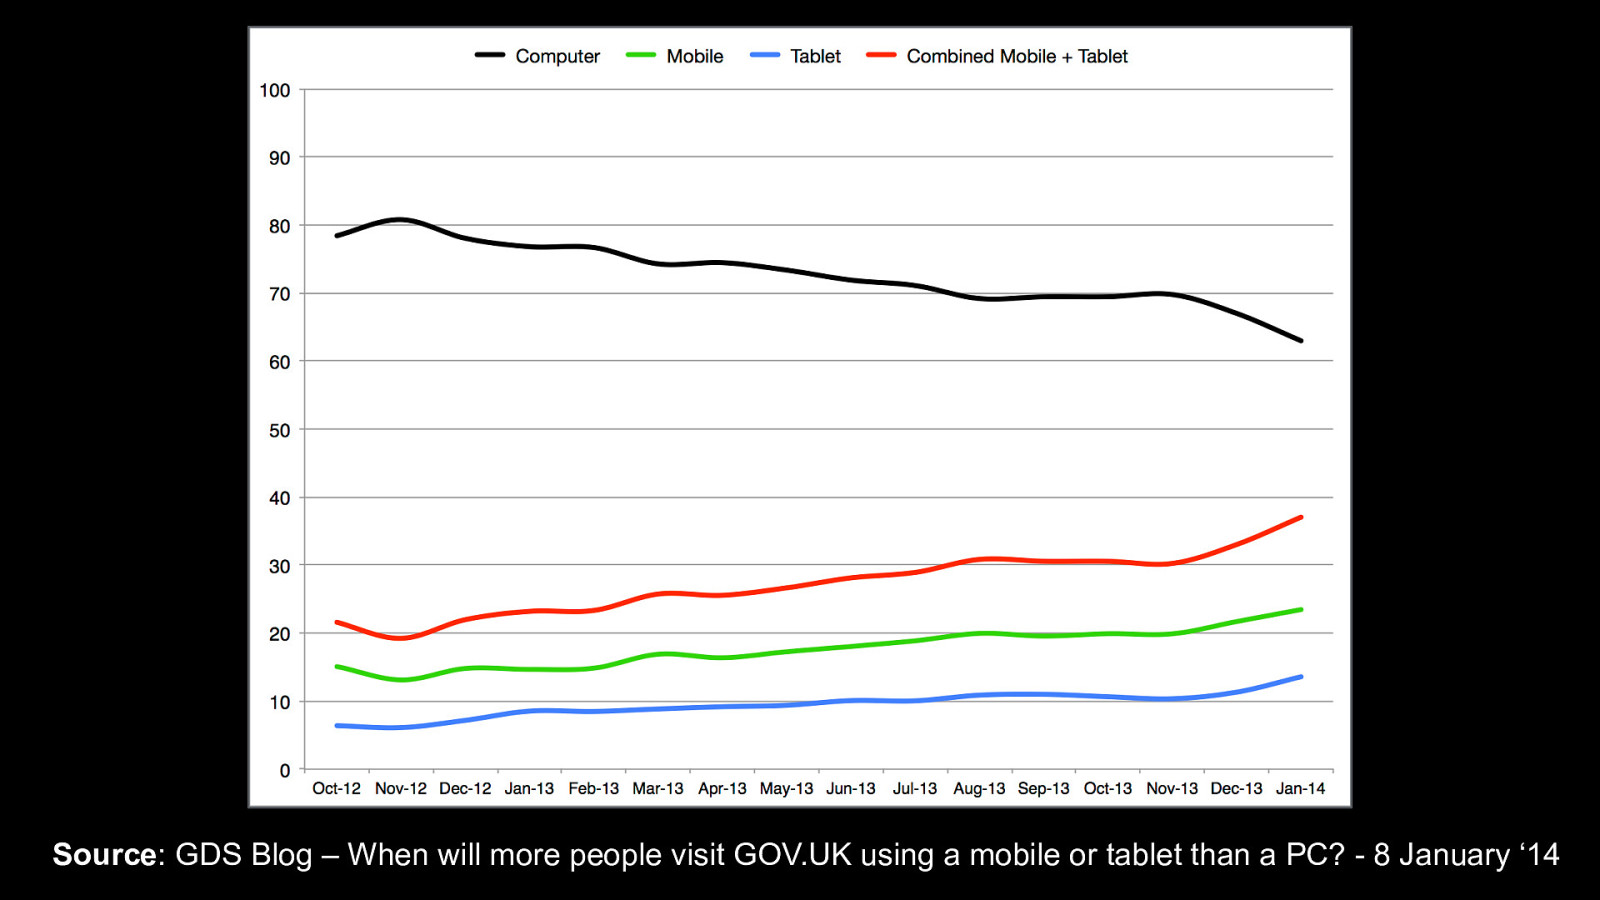
Source: GDS Blog – When will more people visit GOV.UK using a mobile or tablet than a PC? - 8 January ‘14 In hindsight, there actually wasn’t a market in 2012 for a mobile-first government website. So you can imagine why it was such a controversial decision. In 2012, 80% of the UK population were accessing GOV.UK via a desktop computer. And less than 20% of users were visiting via mobile or tablet.
Slide 44
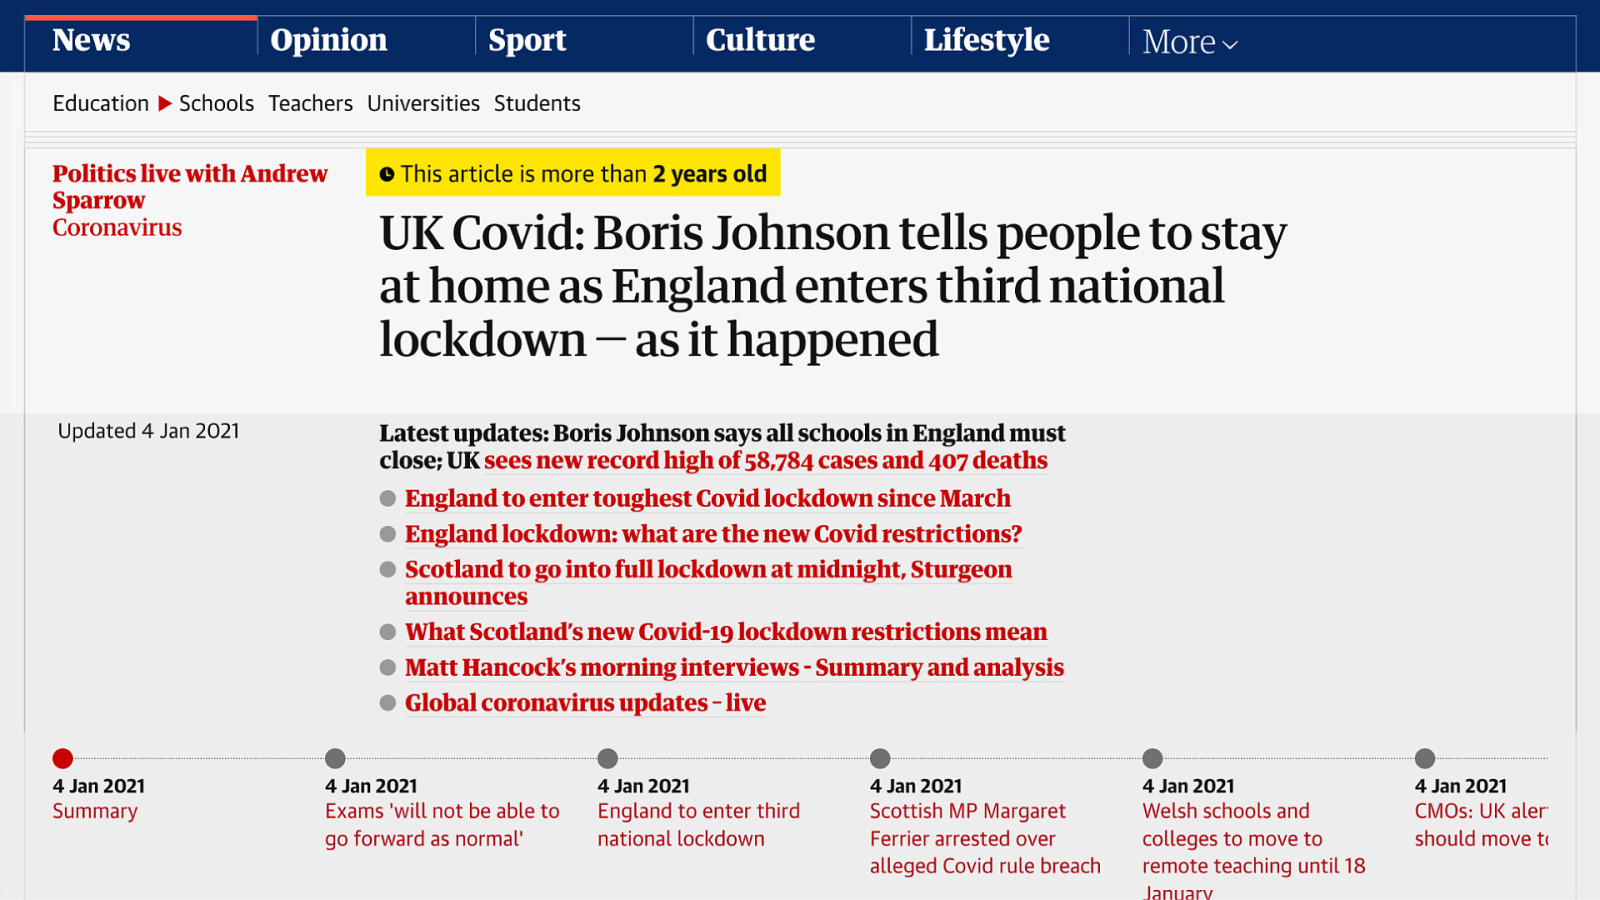
But if we fast-forward 8 years, 2 months, and 9 days to the 4th January 2021, which happens to be GOV.UK’s busiest day ever, things look very different! This is 8 months into the COVID-19 lockdown in the UK. When the Prime Minister, Boris Johnson tells everyone to stay at home for the UK’s third national lockdown.
Slide 45

On this evening GOV.UKs has the highest traffic in its 9-year history! At its peak, the Google Analytics real-time data broke, due to the 88,000 requests per second that were hitting the site.
Slide 46
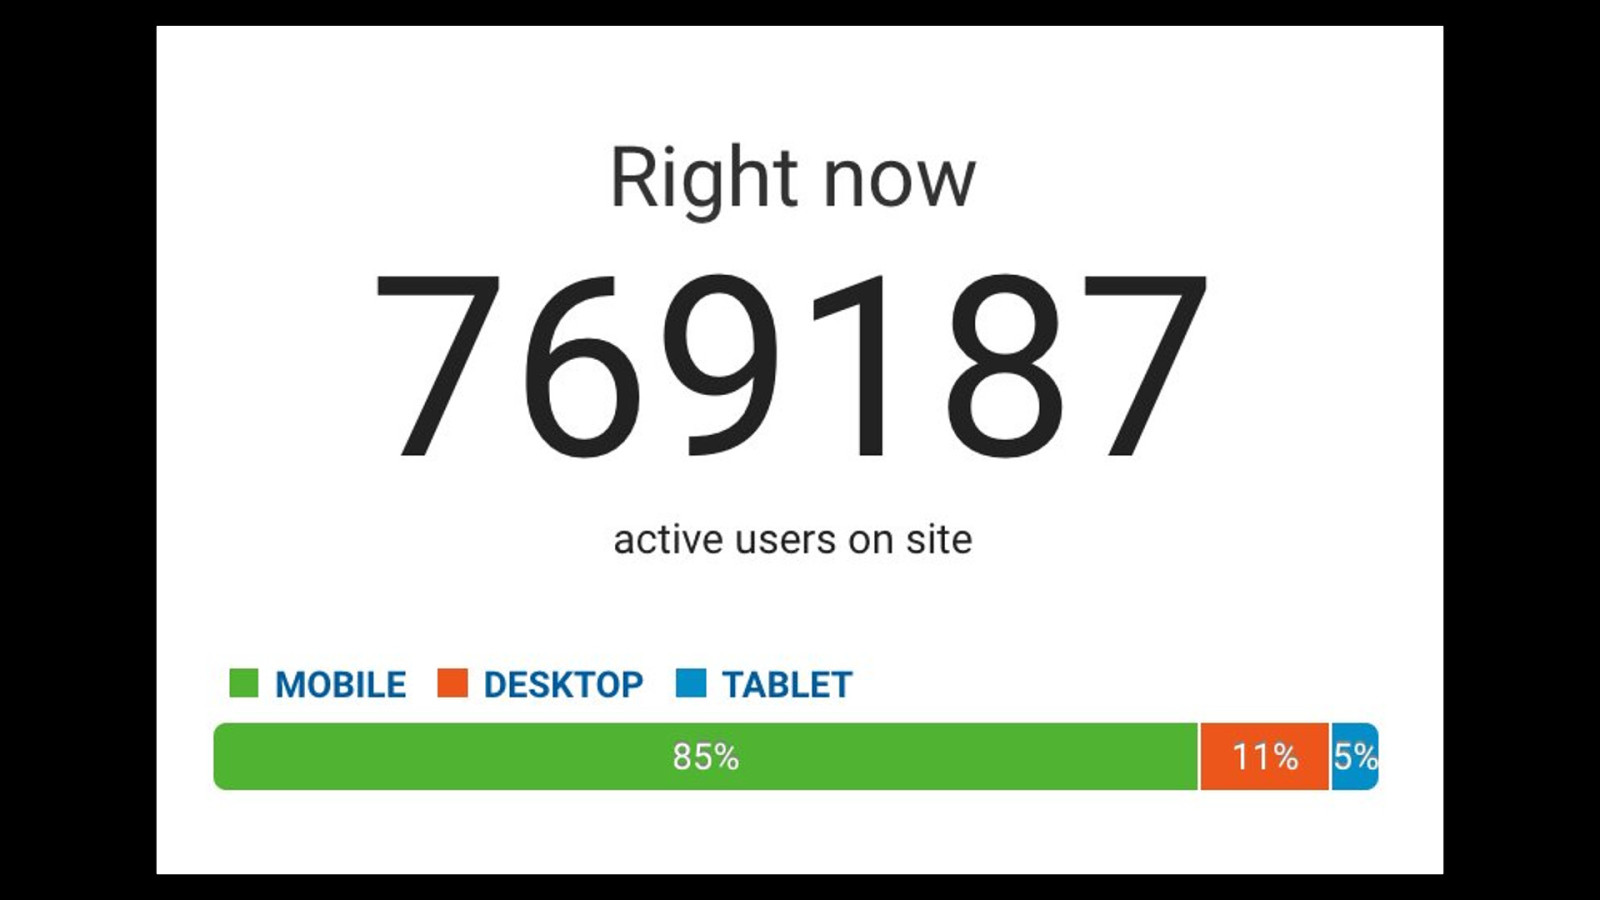
The relevant part to this section, comes from this graphic. When the real-time tracking data broke, 85% of GOV.UK users were using a mobile device! With only 11% of users on desktop. What a difference 9 years can make in technology! [DRINK]
Slide 47
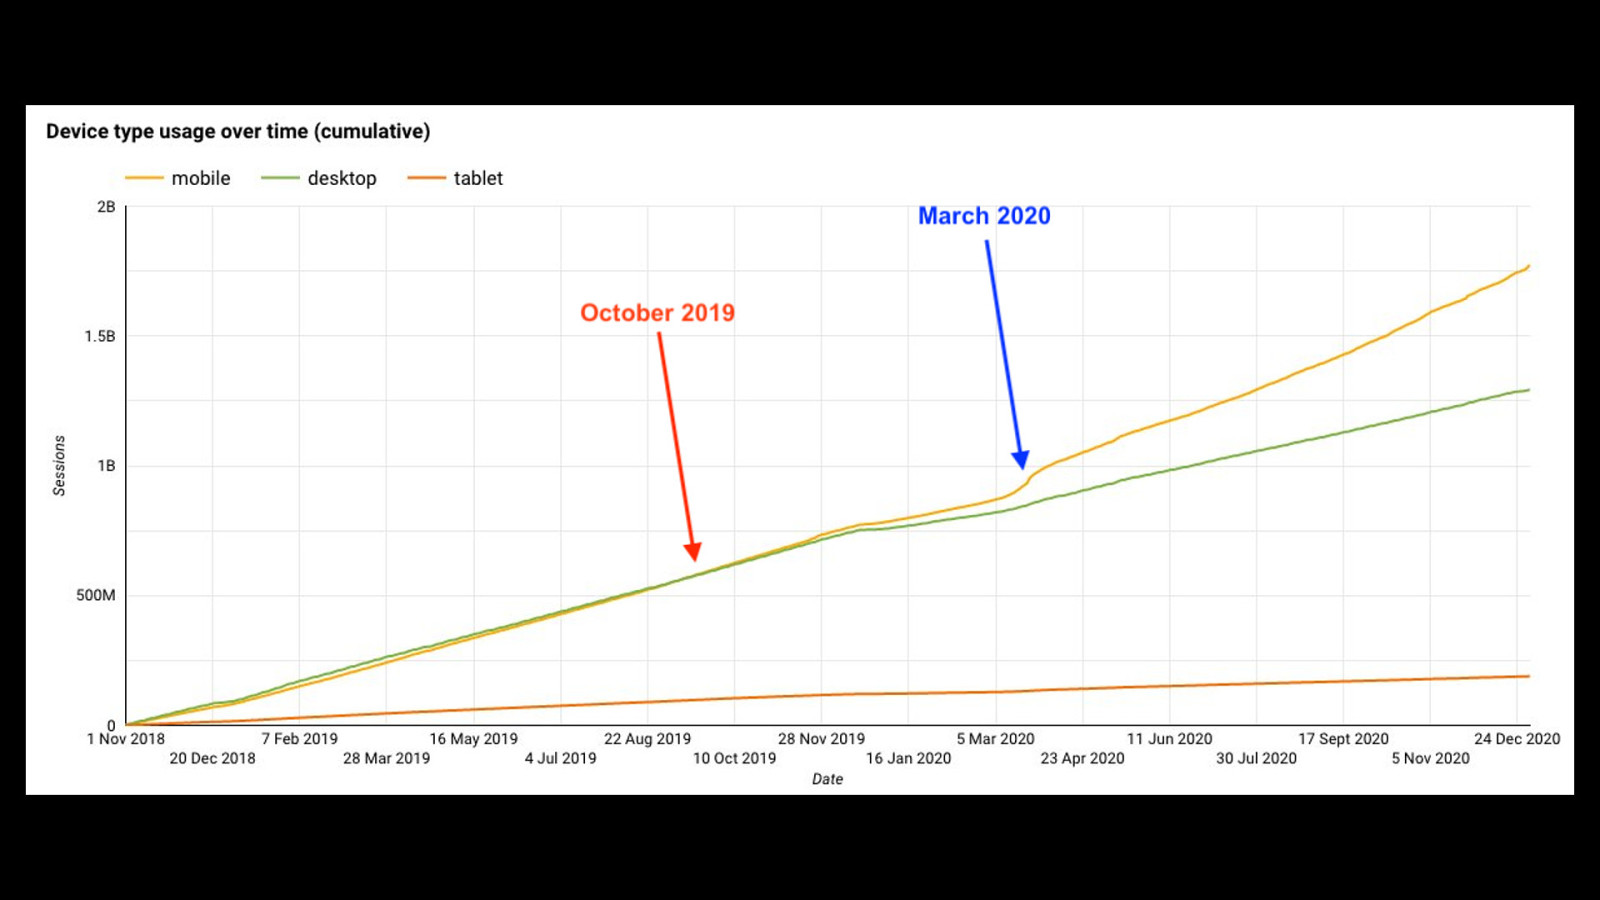
Two other important dates in regards to the mobile-first design on GOV.UK: ● October 2019 was the when mobile usage finally exceeded desktop usage, month on month (as seen here via the red arrow) ● and in March 2020 we saw a huge shift in user numbers using mobiles (seen via the blue arrow). This shift happened to coincide with Boris Johnson, urging everybody in the UK to work from home and avoid pubs and restaurants. COVID-19 looks to have been a catalyst for greater mobile usage at least on GOV.UK anyway! Remember at the time, this was lifesaving information being given to the masses via mobile-first design principles.
Slide 48
If that’s not a reason to bridge the digital divide for everyone in society, regardless of their location or circumstances. I don’t know what is! What we are seeing here is an example of how mobile first and optimised efficient web design saved lives.
Slide 49
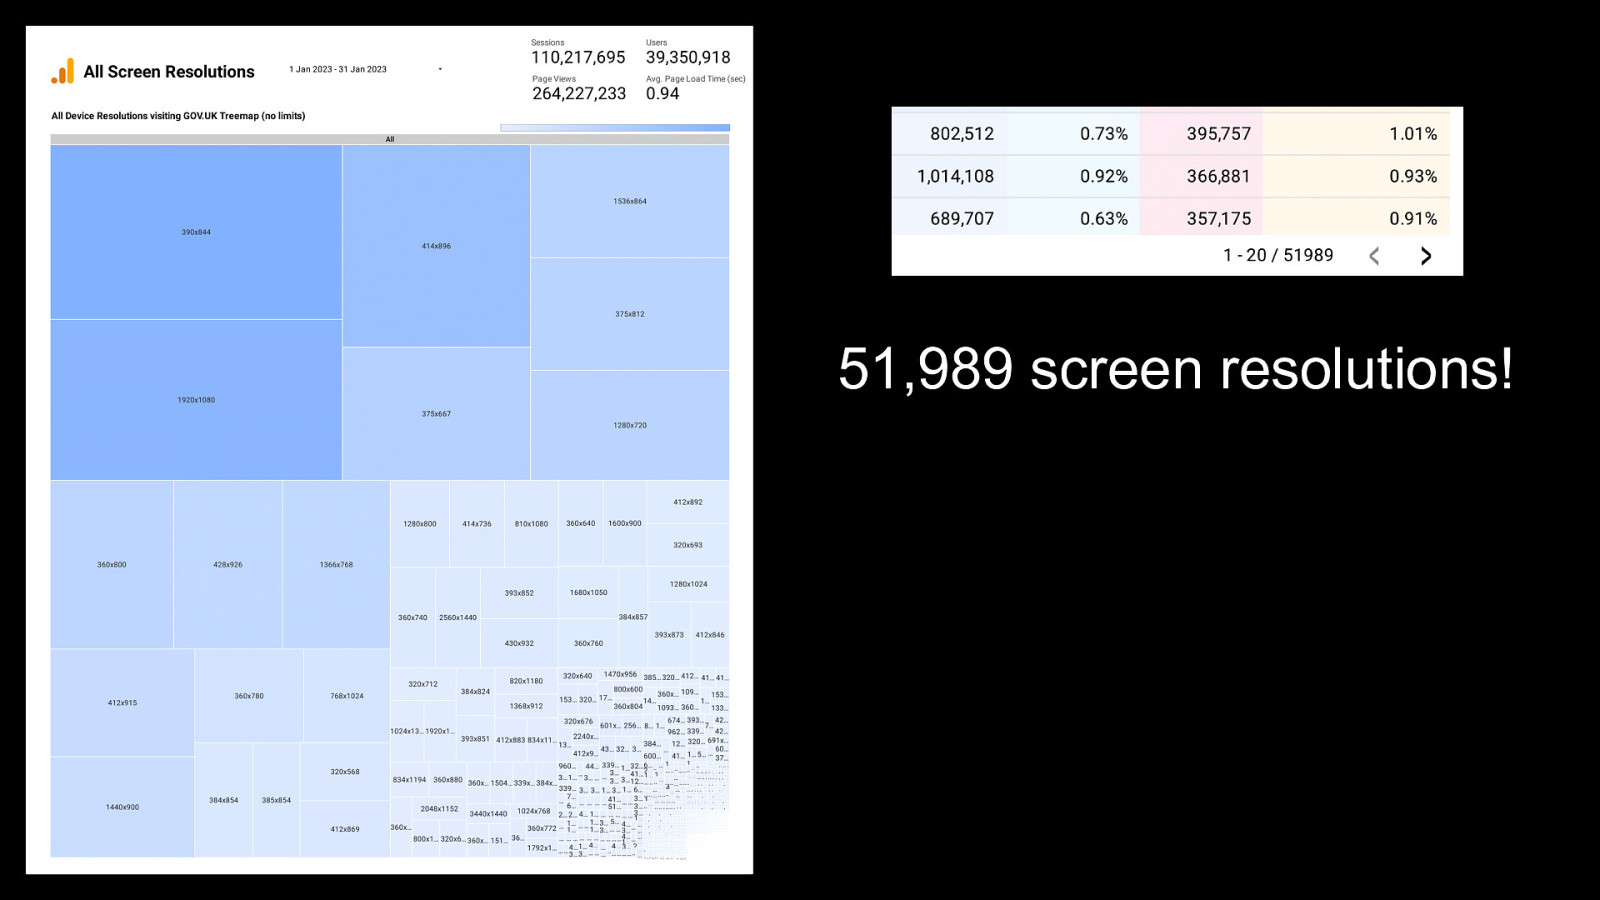
51,989 screen resolutions! To reiterate the importance of mobile-first, responsive design, across a large population. Here’s some more GOV.UK data from the start of this year. On the left is a heat map of all screen resolutions that visited GOV.UK in a single month. There are so many resolutions towards the bottom right corner of the image, the text disappears into a blur of thousands of individual resolutions. On the right is the actual number of combinations seen. The important number here is 51,989 screen resolutions visiting GOV.UK in a single month. Thank goddess for mobile-first responsive design!
Slide 50

There’s way too many resolutions and devices to test on, so resilience and flexibility has to be built into the design to cater for every user visiting. No matter what device or screen size they are using.
Slide 51
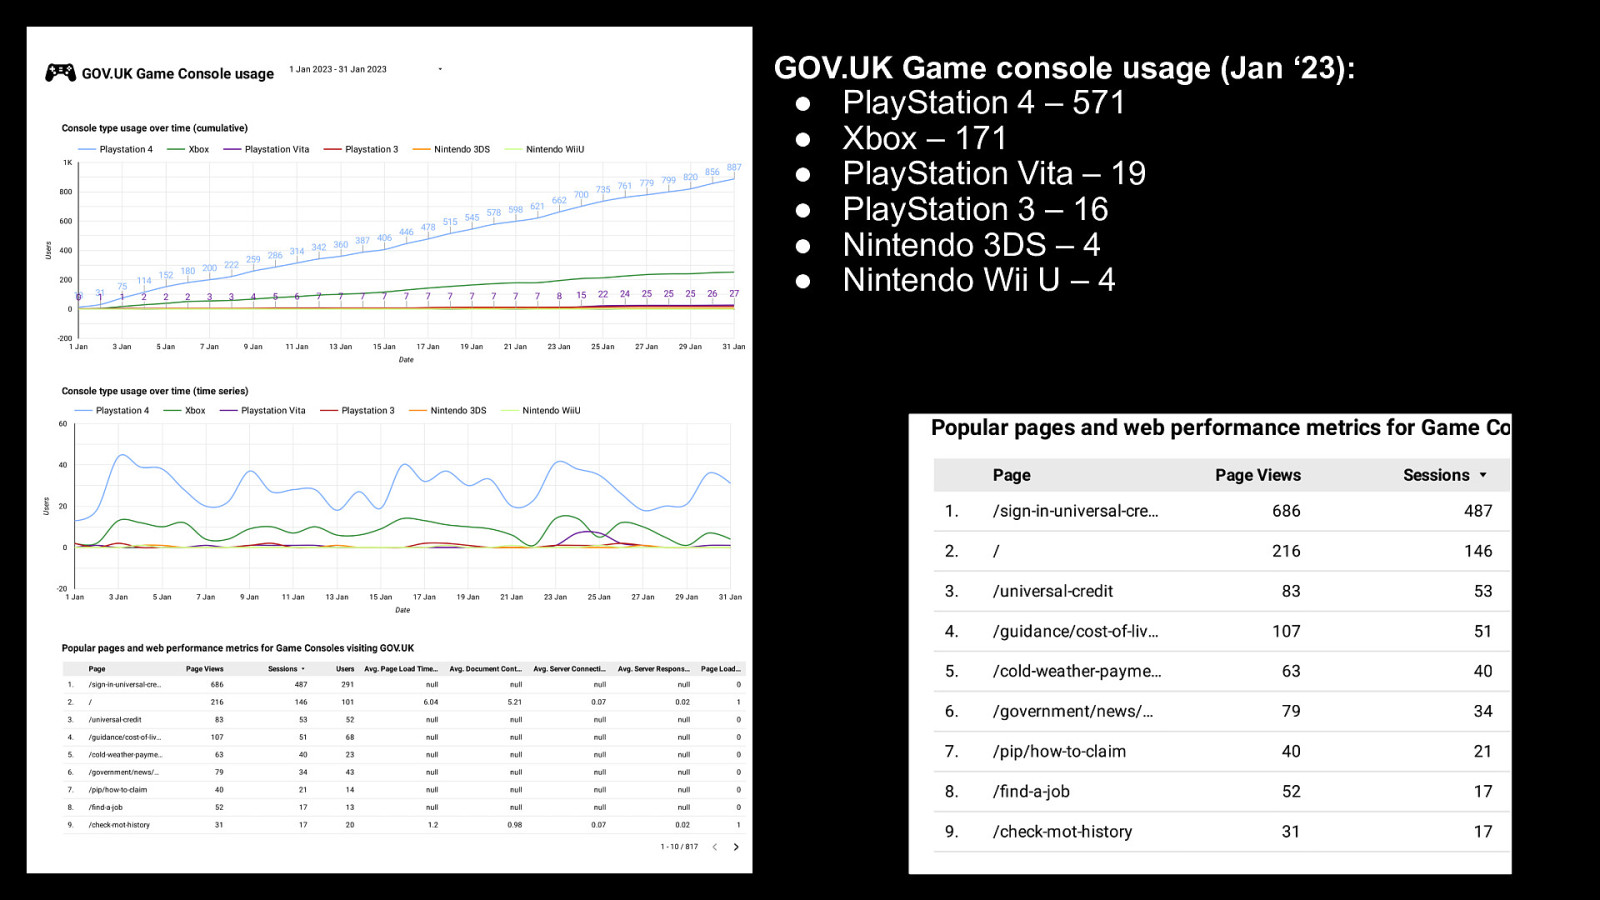
GOV.UK Game console usage (Jan ‘23): ● ● ● ● ● ● PlayStation 4 – 571 Xbox – 171 PlayStation Vita – 19 PlayStation 3 – 16 Nintendo 3DS – 4 Nintendo Wii U – 4 Speaking of user devices, it isn’t always desktop, tablet, and mobile phones being used either. Usually the most popular tweet in the GOV.UK stats thread I posted on Twitter every month was this one. Month-on-month we saw users using games consoles to visit GOV.UK. And delving into the data, they aren’t only visiting the homepage! There are vulnerable people trying to visit the site to find a job, find information on the cost of living, and sign in to their Universal Credit account. There’s a User Story that is always spoken about at GDS, It was written up by Terence Eden who was witness to it.
Slide 52
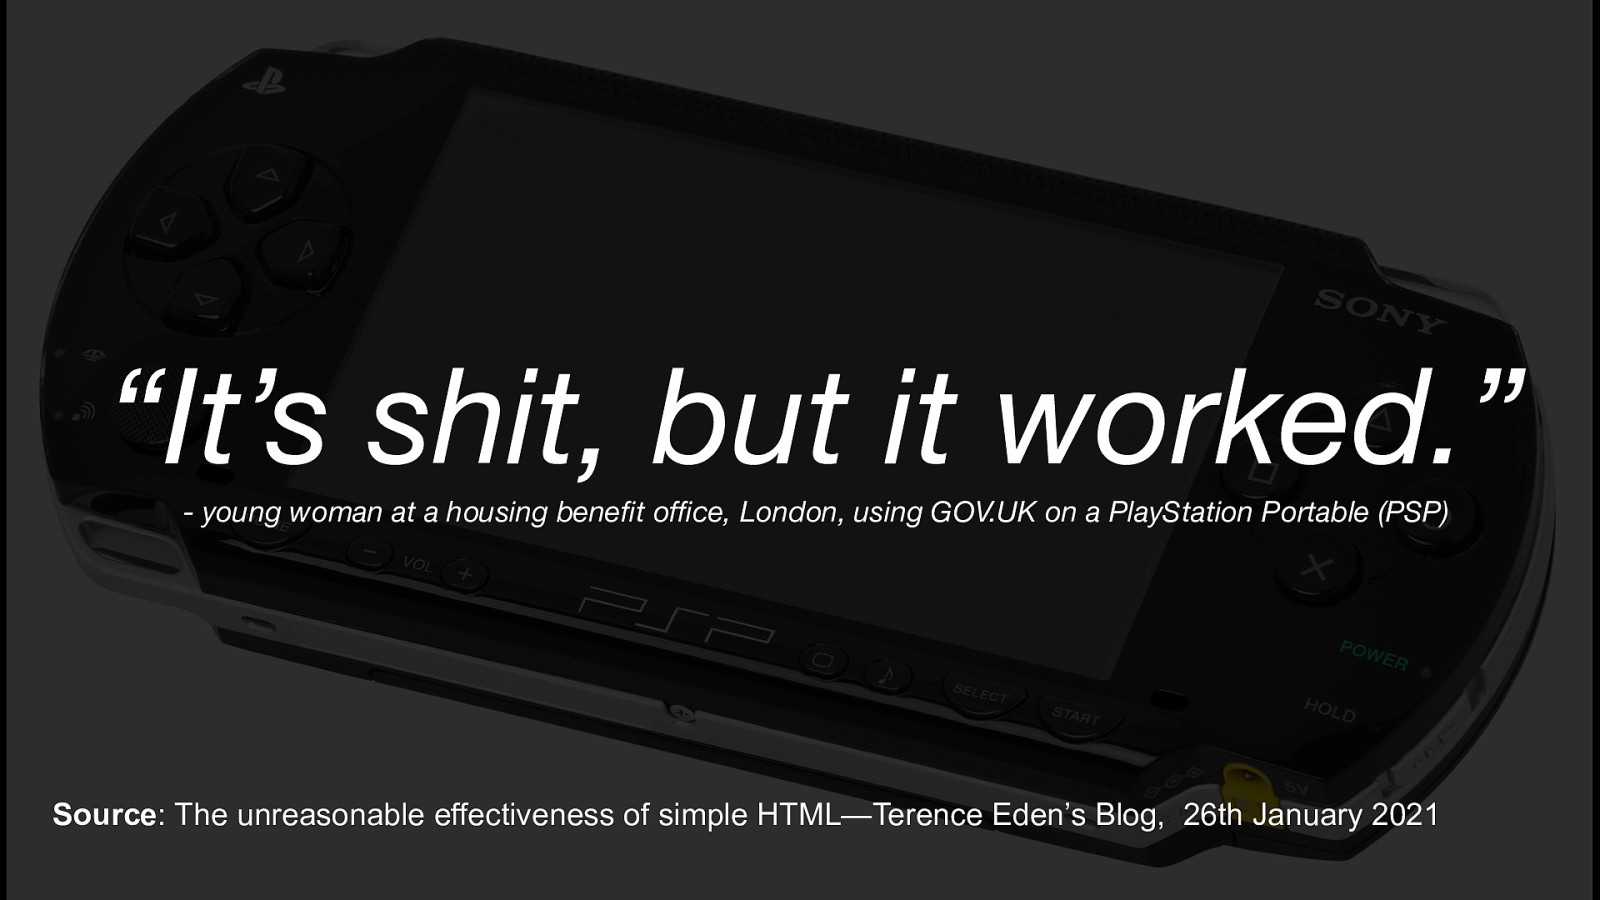
“It’s shit, but it worked.” - young woman at a housing benefit office, London, using GOV.UK on a PlayStation Portable (PSP) Source: The unreasonable effectiveness of simple HTML—Terence Eden’s Blog, 26th January 2021 I’ll try to paraphrase the story for you here: ● Terence is doing policy research in a housing benefits office in London. ● A young woman sits in the middle of the office and is surrounded by bags, these are all her worldly possessions ● She is holding a Playstation Portable (PSP), he assumes she is playing a game to pass the time. ● It turns out she is using the free wi-fi and the PSP’s crappy web browser to read the Housing benefit pages of GOV.UK. She’s been kicked out of her parents house and she has nowhere to live. ● The PSP is a hand-me-down from an older brother. When asked about why she’s using a PSP to browse the internet. Her response is “It’s shit. But it worked.” My paraphrased version doesn’t do the story justice, so I’d recommend reading Terences blog post in full. It’s called ‘The unreasonable effectiveness of simple HTML’. This reiterates everything Ryan was saying in his excellent talk yesterday! So if there’s only one thing you take away from this talk today it’s: When building a website in the future, remember to consider users whose response to the device they are using is. “It’s shit, but it worked”!
Slide 53
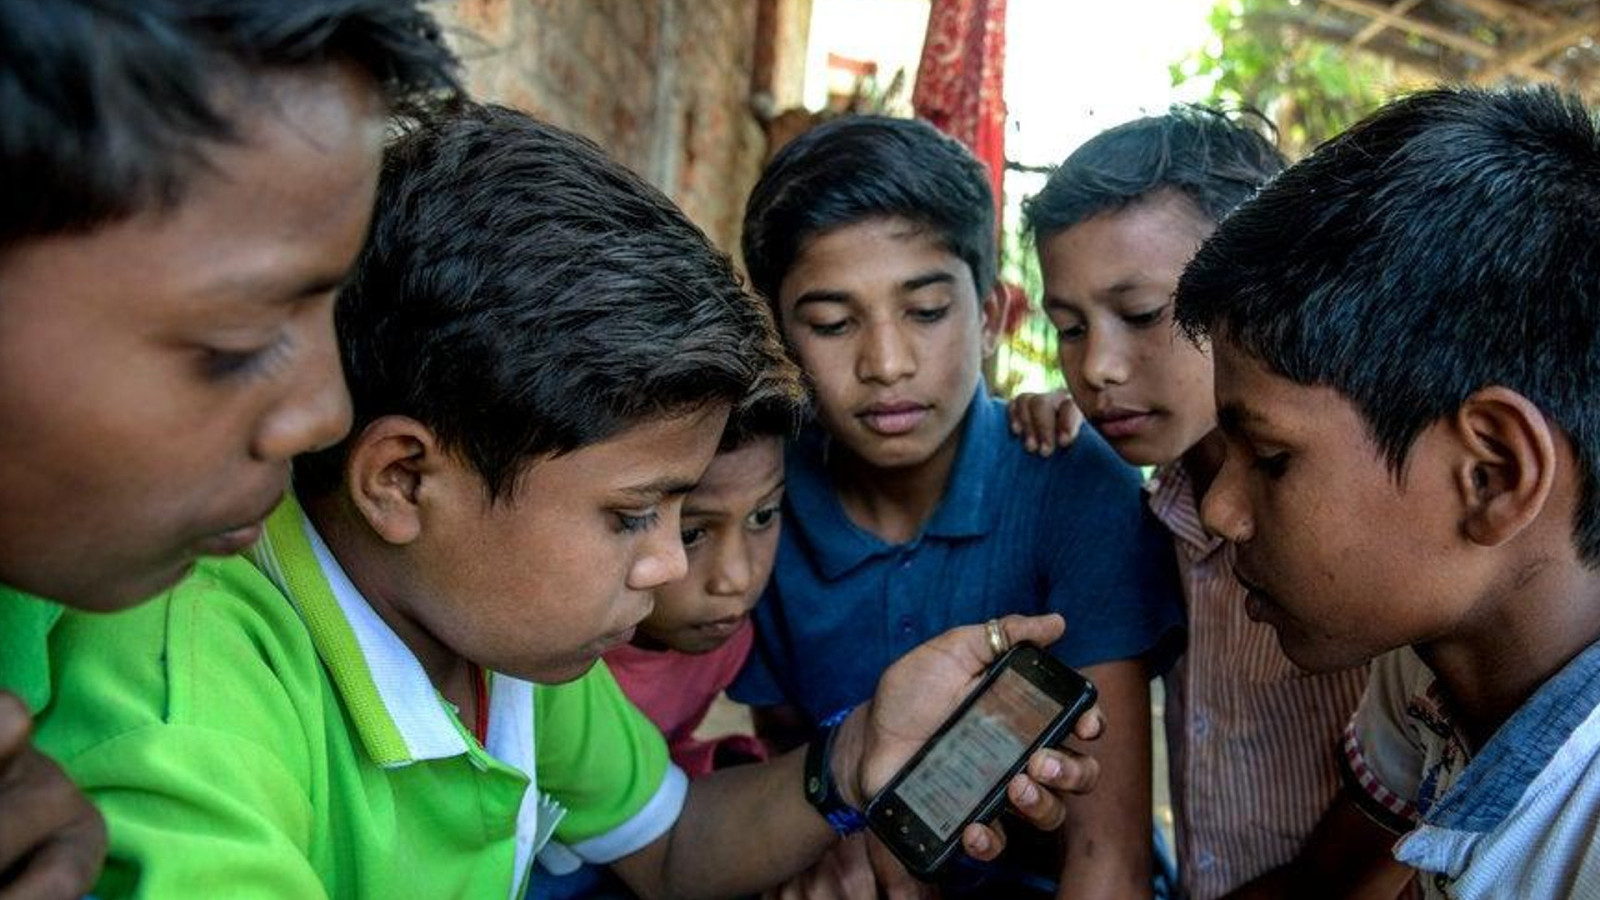
As I’d imagine there are millions of people across the world who are in a very similar position to the young woman mentioned in the story. They can’t afford the latest devices or the data required to use them, so they are using a 2nd or 3rd-hand device. With a borrowed internet connection to complete the tasks they need too. [DRINK]
Slide 54
- Accessibility Considerations and Digital exclusion Number 3: Accessibility Considerations and Digital exclusion. I can’t stress this point enough. If we want to bridge the Digital Divide and reduce digital exclusion. Accessibility is a huge part of the problem that needs consideration. By accessibility I mean both the literal meaning: ● a user being able to gain access to the information that they need. ● and also use of assistive technologies like screen readers and braille readers. Where as there’s no legal requirement for a fast and performant website, the same can’t be said for Accessibility. In certain sectors of the UK and EU compliance with WCAG is a legal requirement, and soon a new regulation will become law called the European Accessibility Act, more on this in a few slides time. The US has similar requirements with Section 508, and ADA (Arda). In my opinion, good web performance also means ensuring that websites are accessible to users with disabilities. This means creating websites that are compatible with assistive technologies. And designing interfaces that are easy for everyone to use.
Slide 55
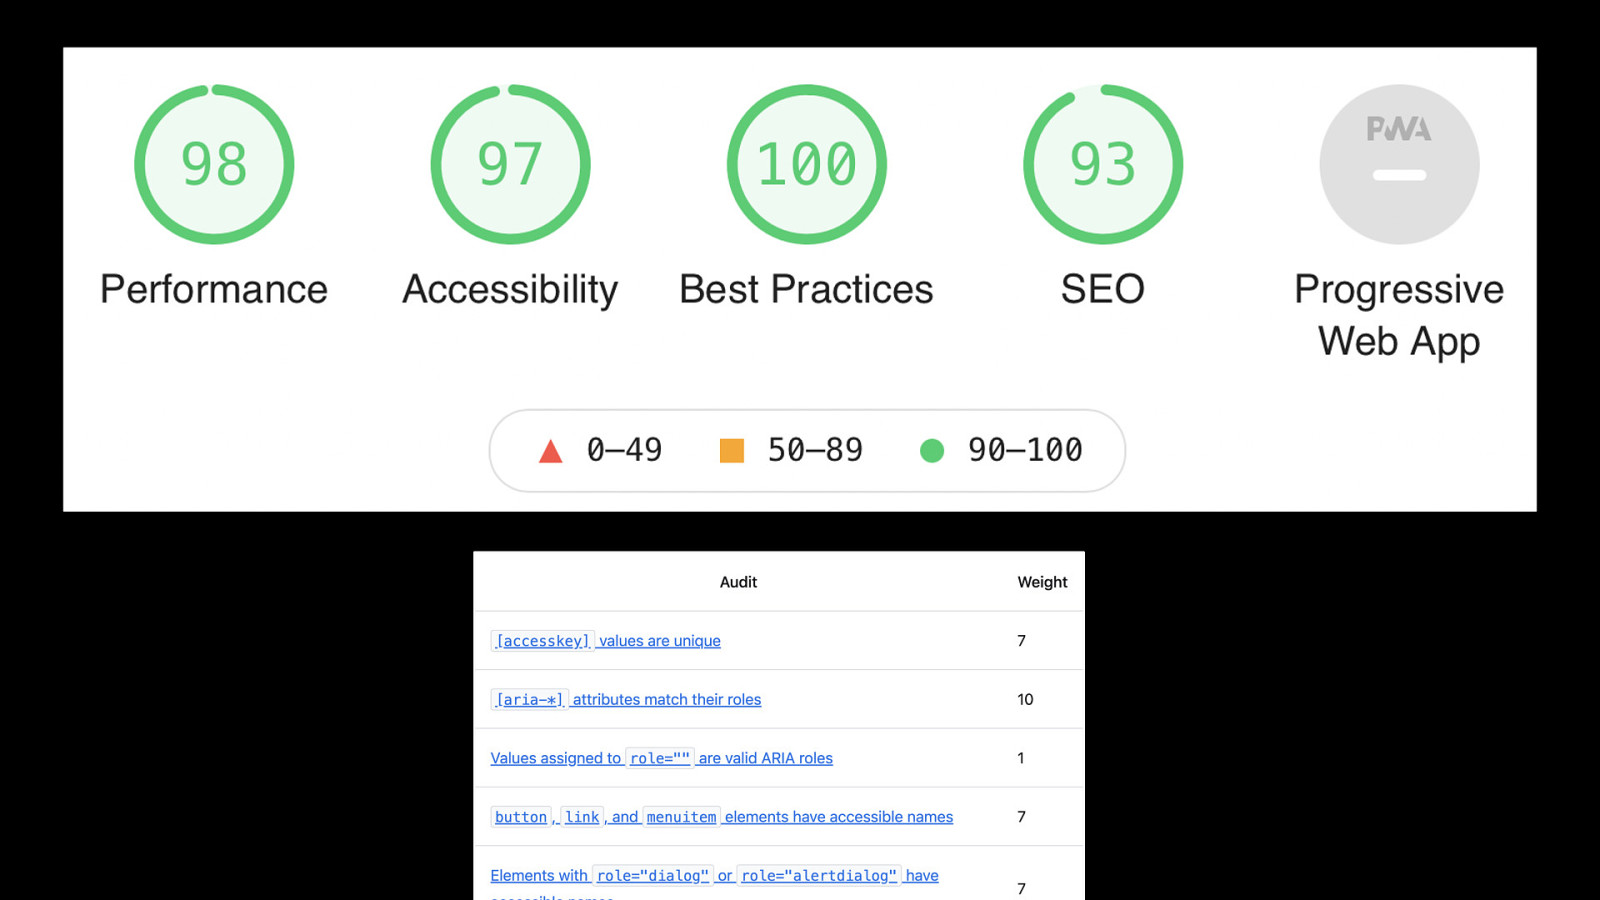
Now, since Chrome Lighthouse comes with whole set of accessibility audits. I’d like to think that many in the Web Performance community agree with this stance. On the slide, you will see a small number of accessibility audits Lighthouse looks for. According to my last review of the documentation it has 57 that it runs in total for accessibility.
Slide 56

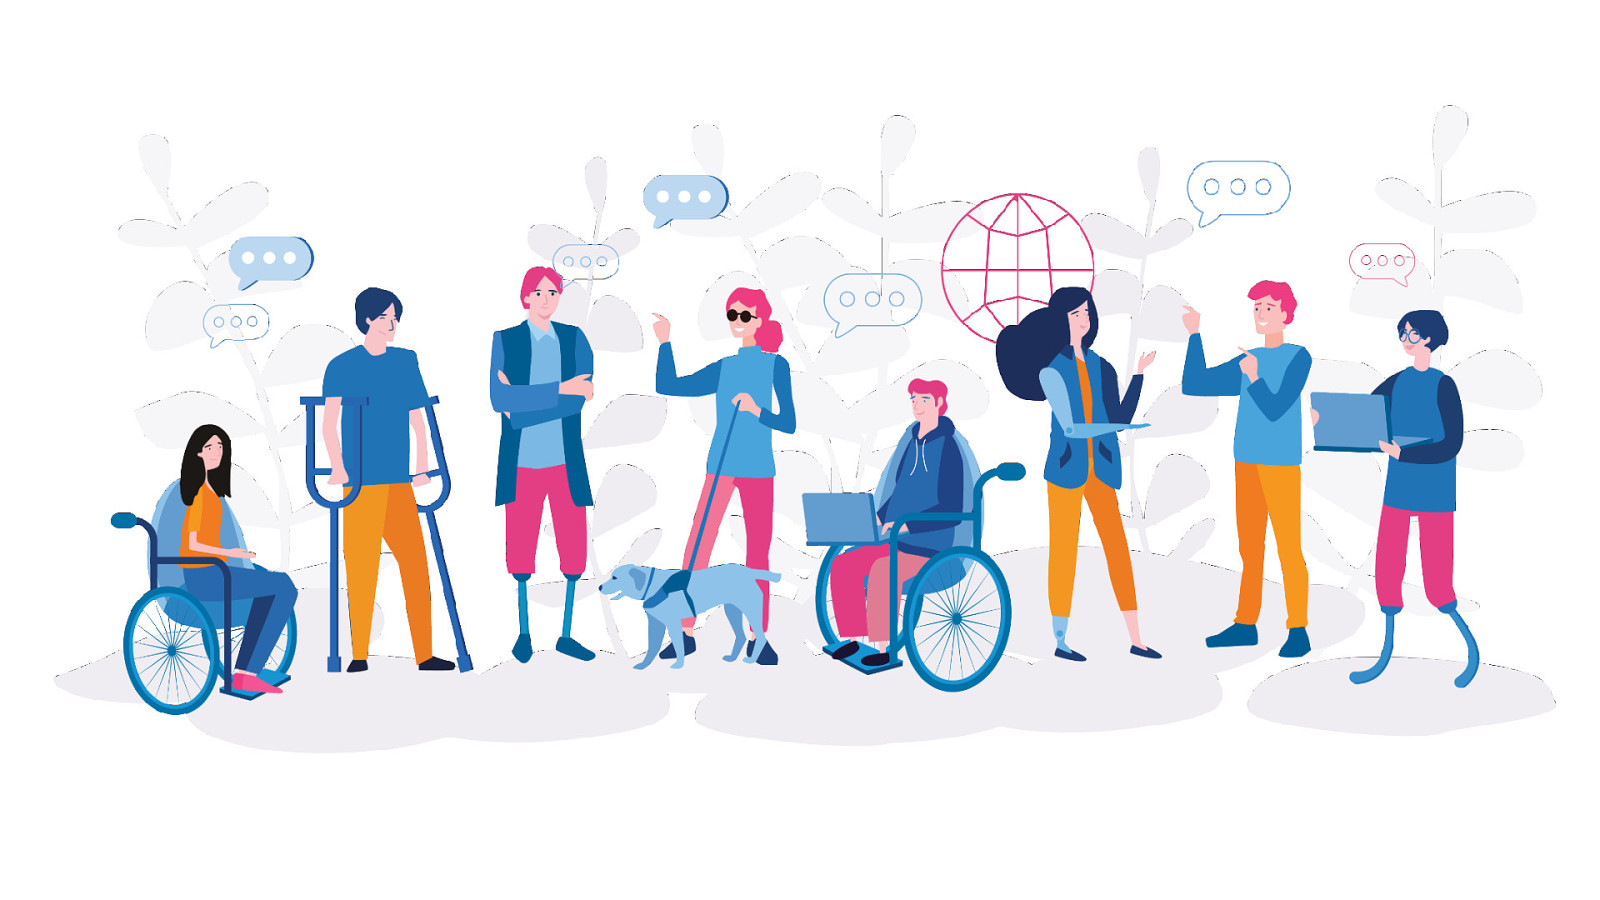
When many people mention accessibility, a large proportion likely think of this. This is the symbol used in the UK to signify somebody in a wheelchair or a person with a physical ailment. But as I mentioned earlier about how the Digital Divide isn’t only an young vs old demographic issue. It’s exactly the same for accessibility…
Slide 57

“We’re all just temporarily abled” - Abraham Lincoln …as the saying goes “we’re all just temporarily abled” So design and build for your future self! But there’s more to Accessibility than physical ailments…
Slide 58
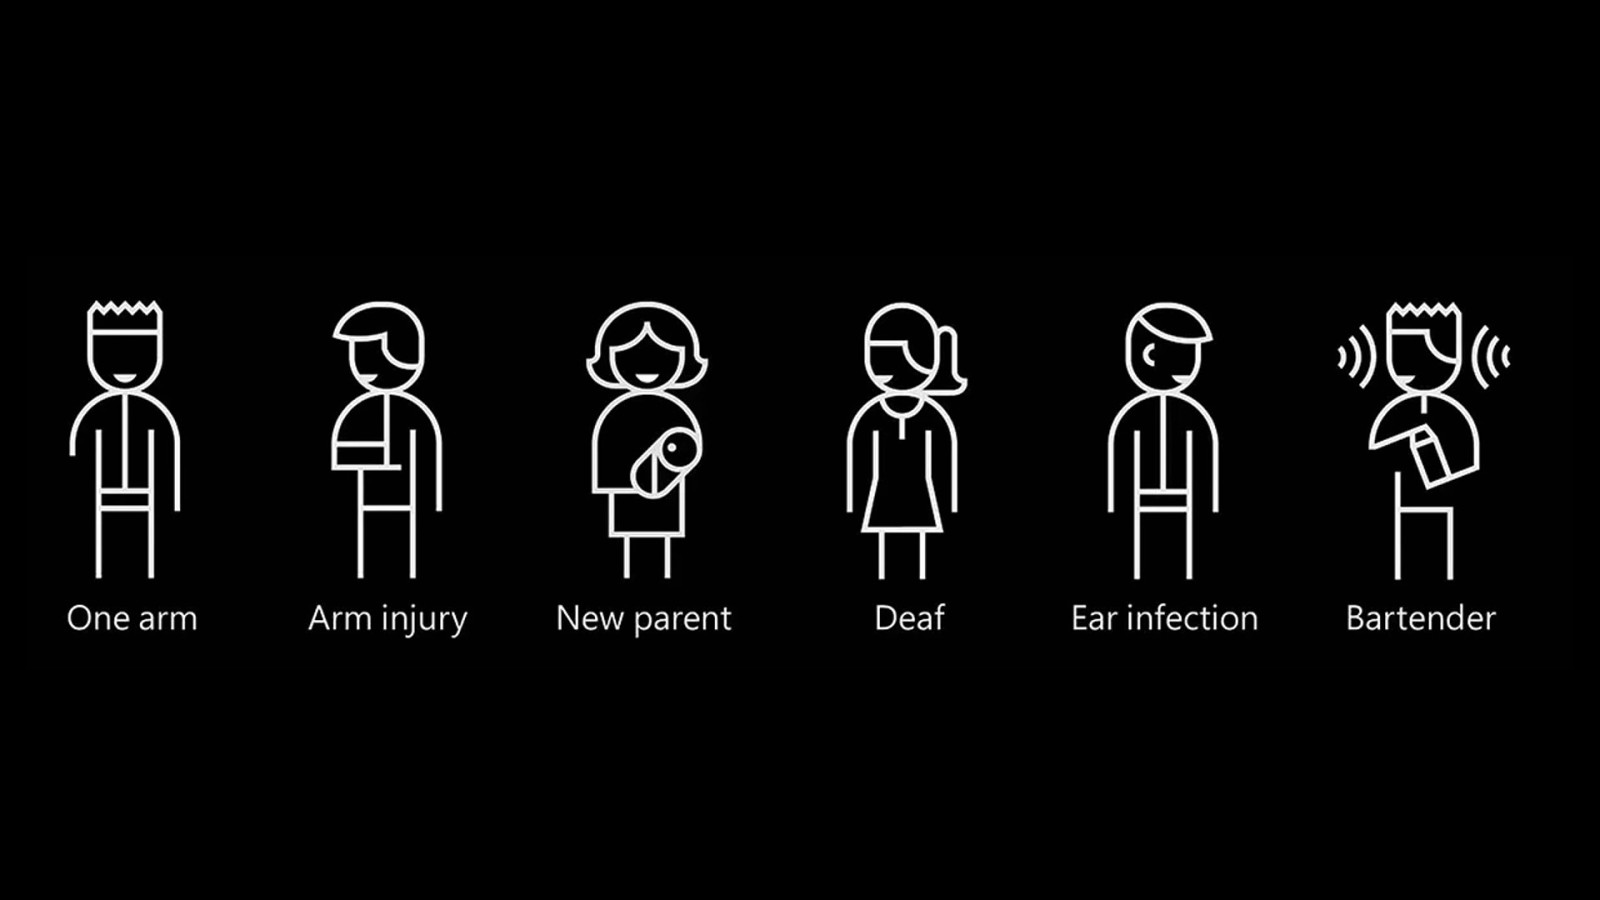
…here we have 6 icons from Microsoft that they use when talking about inclusive design. Listed, we have permanent disabilities like: ● Having one arm ● Deafness ● Blindness ● Being a new parent And also temporary disabilities like: ● Having an injury ● Having an ear or eye infection Then there are situational disabilities like: ● Being in a noisy or distracting environment ● Or a place with poor lighting but there’s actually more to consider…
Slide 59

…not included in the previous slides are the hidden disabilities. These include things like: ● Autism ● Mental health issues ● Sensory processing disorder ● Multiple sclerosis ● Dyslexia ● Dyspraxia ● Epilepsy And one I know well, Traumatic brain injury (e.g. from brain surgery)
Slide 60

Hello! 👋 I don’t mind talking about this quite traumatic part of my life, but for those who don’t know, in April 2021 I was diagnosed with a huge brain tumour.
Slide 61

After 7-hours of brain surgery, in which 15% of my brain matter was removed. I not only woke up with the worst headache of my entire life. But also a really annoying temporary weakness in my left arm and hand, meaning I couldn’t use my phone and laptop fully for many weeks post-surgery. If you are interested in what my brain looks like, the before & after MRI scans are on the slide now! In fact, I’m still considered disabled as I am prone to seizures and have to take daily medication to control them.
Slide 62
Apologies for the huge tangent there. I wanted to emphasise the point that disabilities come in all shapes and sizes, hidden and not so hidden. Building for accessibility and inclusivity is challenging. But it is vital if we want to bridge the digital divide!
Slide 63
Web Almanac 2022 Part II Chapter 11: Accessibility As I mentioned earlier, I’d like to think that as you’re all attending this wonderful web performance conference. You’re already thinking of building inclusive websites that minimise their device footprint and utilise efficient use of a users limited data. An excellent source of the current state of accessibility on the web is the Web Almanac, which I’m sure many of you have read or even contributed too! I know Rick Viscomi is here today who is Project Lead on the Almanac, so big shout out to him for all his hard work over the years!
Slide 64
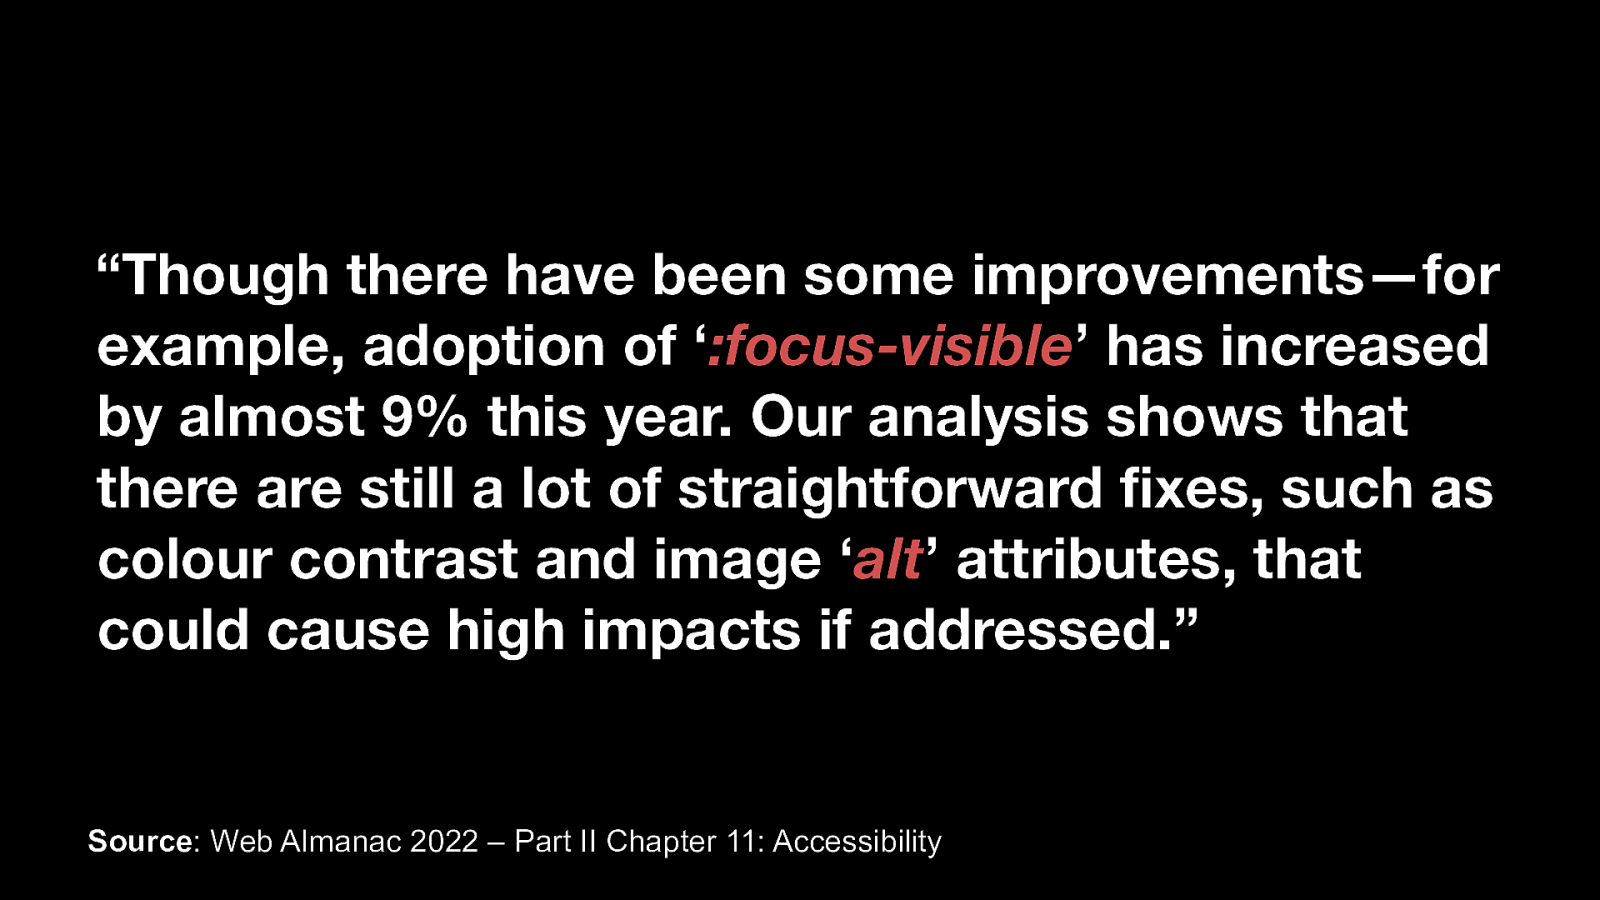
“Though there have been some improvements—for example, adoption of ‘:focus-visible’ has increased by almost 9% this year. Our analysis shows that there are still a lot of straightforward fixes, such as colour contrast and image ‘alt’ attributes, that could cause high impacts if addressed.” Source: Web Almanac 2022 – Part II Chapter 11: Accessibility Comparing the 2021 Vs 2022 Almanac reveals some positives like: ● There’s been an almost 9% increase in the use of ‘:focus-visible’. But it also goes on to say there’s still plenty to do to with straightforward fixes like: ● Using image alt tags correctly, approximately 2.2% of websites have ‘alt’ text containing a file extension. ● Fixing anchor tags with a role of button, which according to the Almanac 20% of websites do! ● And finally, adjusting pages so they have improved colour contrasts Just fixing these 3 issues could improve accessibility on a large number of websites.
Slide 65
“no MVP without accessibility” - Anna E. Cook Source: Web Almanac 2022 – Part II Chapter 11: Accessibility Like Anna E. Cook once said, there’s “no MVP without accessibility”. The web community needs to realize that a website only has a great User Experience when that User Experience works for everyone. Irrespective of the device and assistive technology used. It’s this User Experience built for everyone that is going to be key in bridging the digital divide across all demographics. And Web Performance is an incredibly important part of delivering a good User Experience.
Slide 66
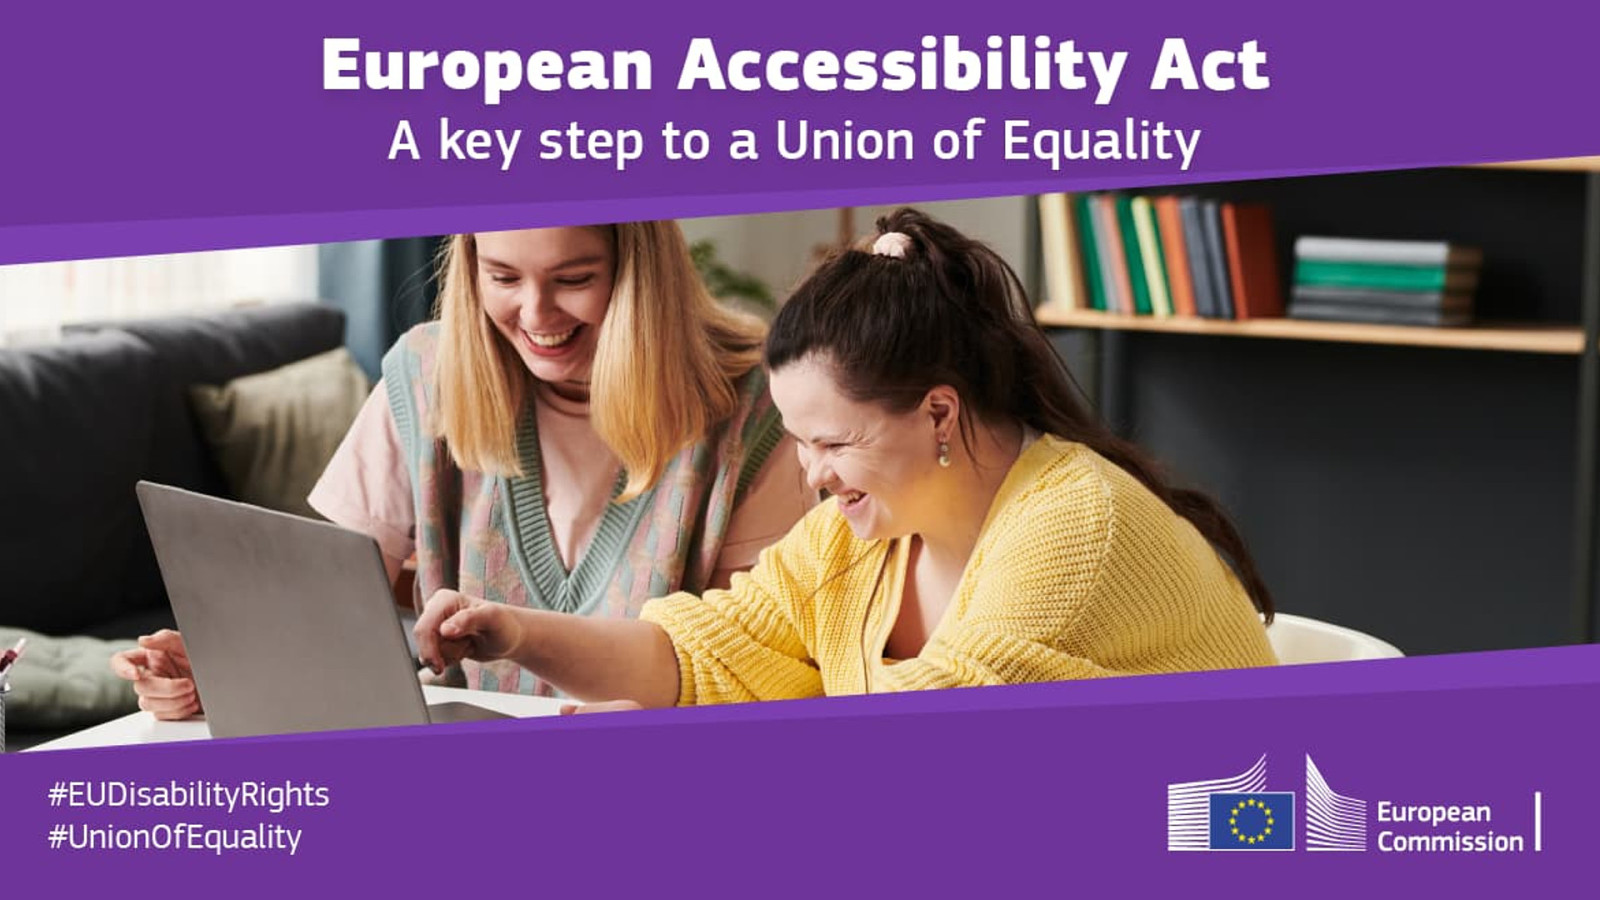
As I briefly mentioned earlier. If you are a company that wishes to do business in the EU you should add the 28th June 2025 to your diary. As this is when the European Accessibility Act becomes law for all member states. I’d recommend making your business ready for this important upcoming date to avoid a ban from trading in the EU for non-compliance.
Slide 67

- Content Delivery Networks (CDNs) Number 4: Content Delivery Networks: They are essential for fast, and resilient websites. Especially ones used by millions of people across the globe. [DRINK]
Slide 68
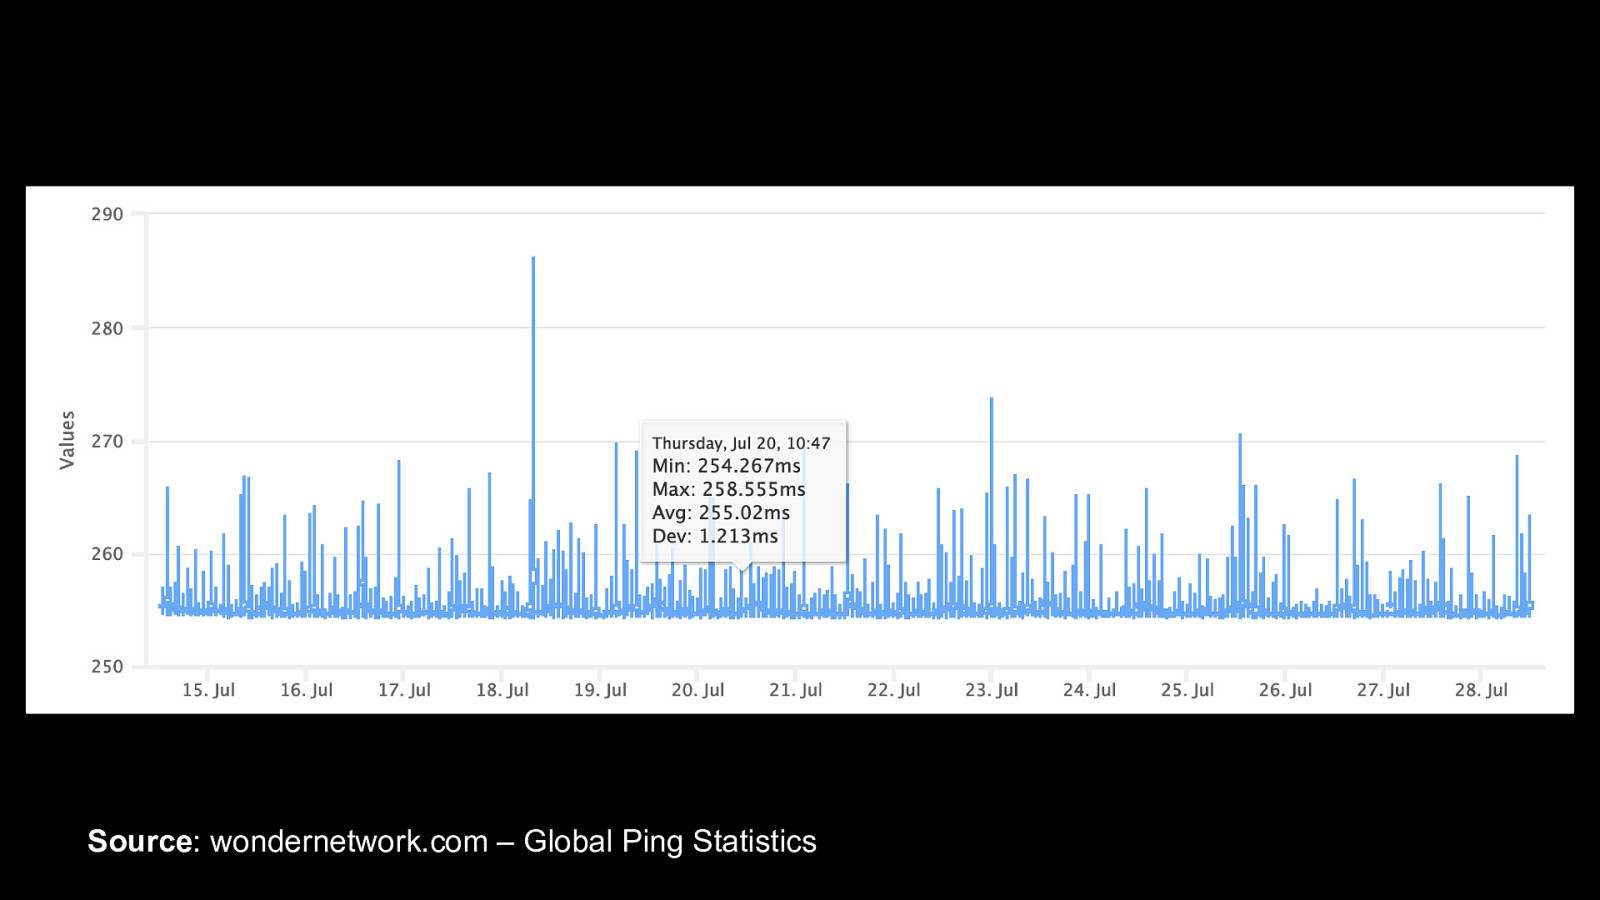
Source: wondernetwork.com – Global Ping Statistics The speed of light is quick, but you are still looking at a ping time or 255+ milliseconds between London and Sydney. As seen in the graph here. 255 milliseconds doesn’t sound like a lot of time. But when HTTP negotiations take multiple round-trips, even before the first byte of website data is sent, this time adds up!
Slide 69
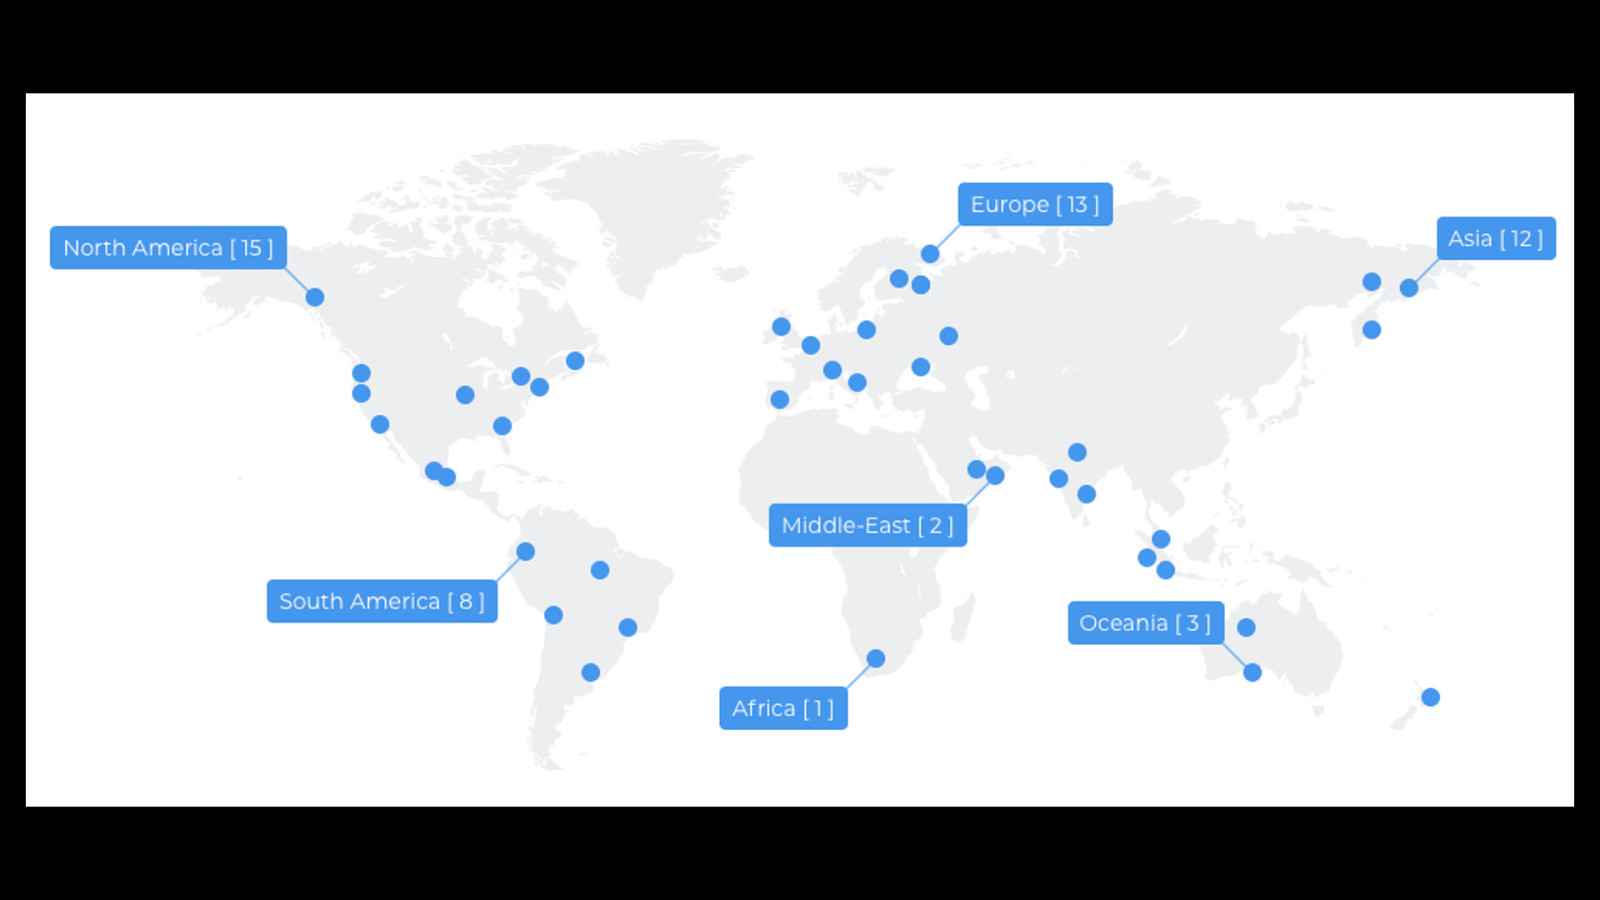
That’s why you want servers in many geographic locations across the world. To mirror your content and deliver it to your users from the server closest to them.
Slide 70
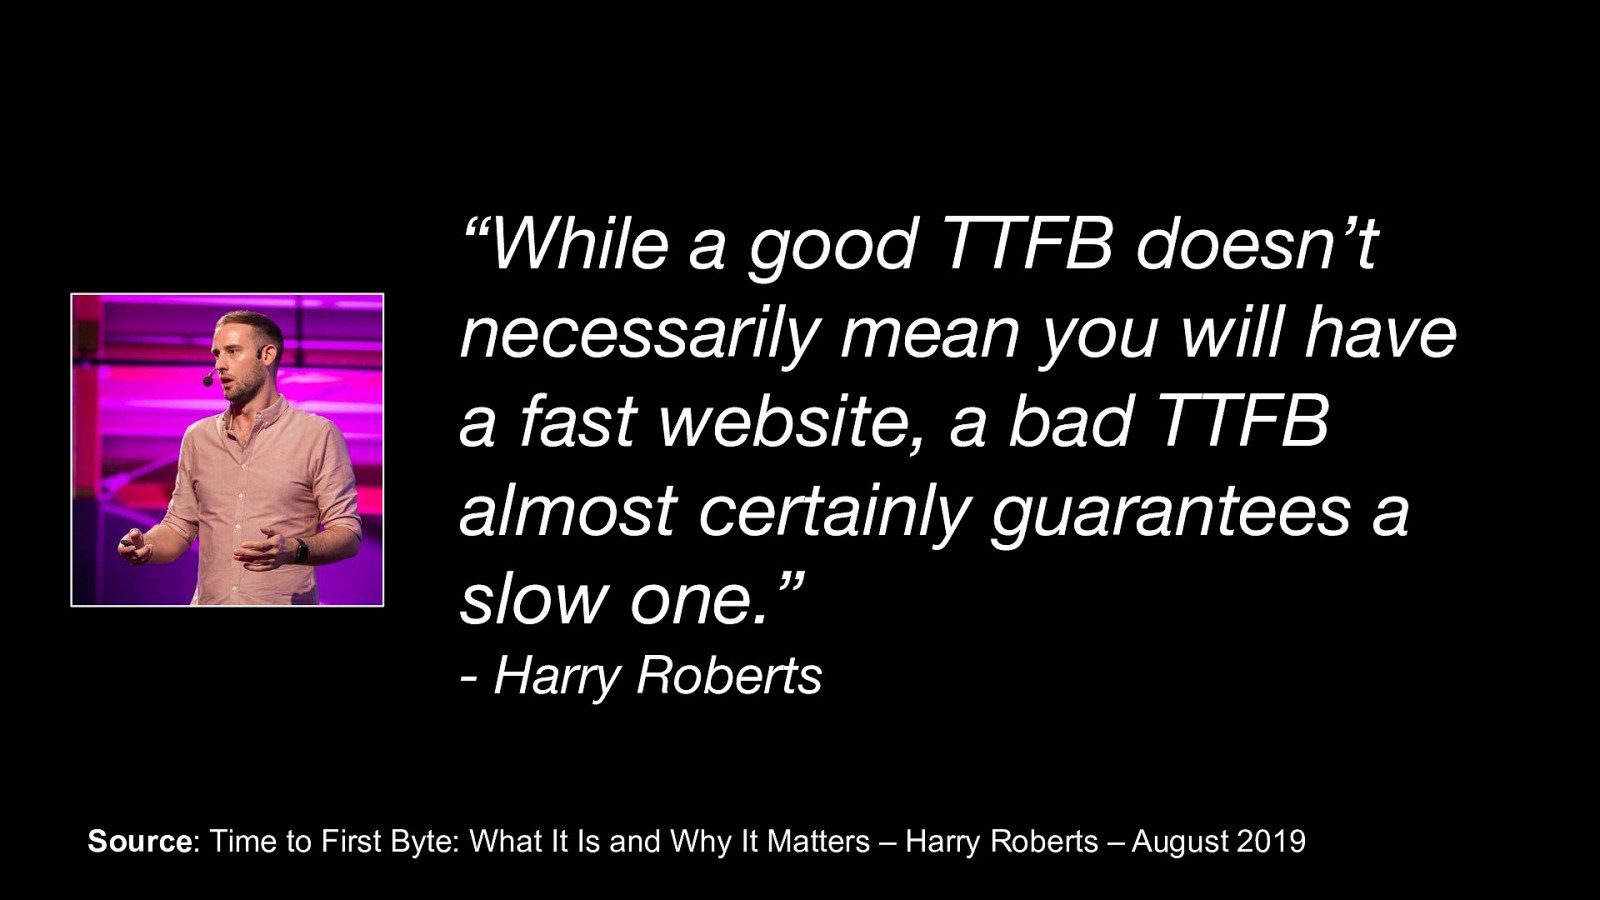
“While a good TTFB doesn’t necessarily mean you will have a fast website, a bad TTFB almost certainly guarantees a slow one.” - Harry Roberts Source: Time to First Byte: What It Is and Why It Matters – Harry Roberts – August 2019 As I’m sure you all know, the specific metric I’m talking about is Time to First Byte or TTFB. And as Harry Roberts said in 2019: “While a good TTFB doesn’t necessarily mean you will have a fast website, a bad TTFB almost certainly guarantees a slow one.” So, make sure to minimise your Time to First Byte to ensure your users aren’t left with a page that is unresponsive and frustrating to use.
Slide 71
Resilience As I mentioned, another very important reason for using a CDN is resilience. What happens to your website when your origin server falls over? More importantly what happens to your users?
Slide 72
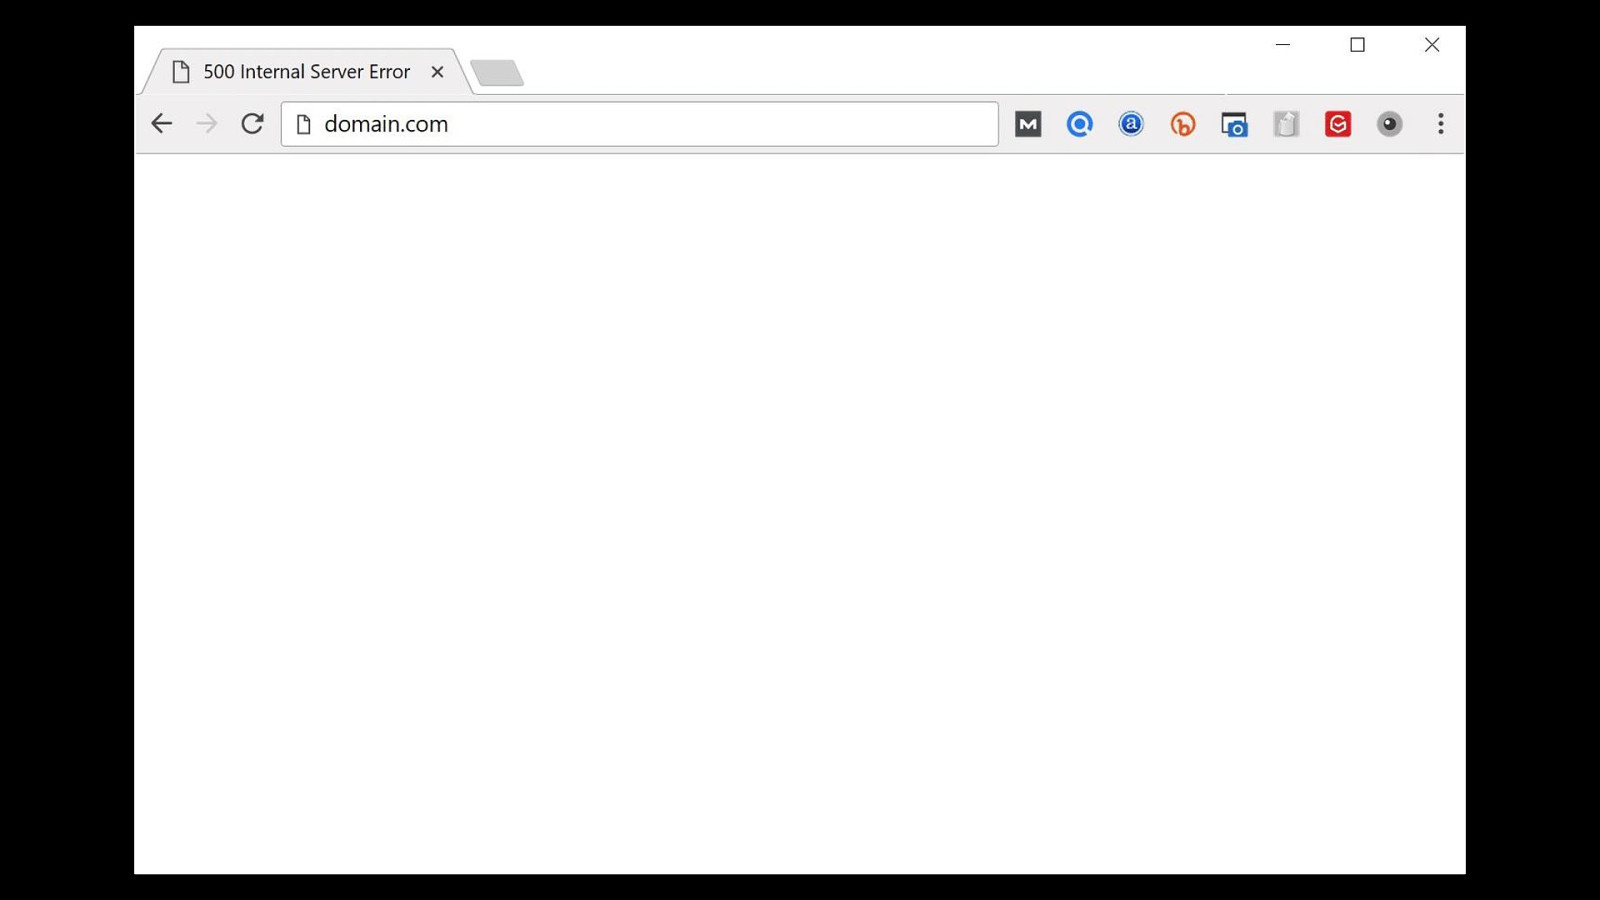
When a user enters your URL into their browser address bar, they are expecting you to still be there. Not an empty white page staring back at them…
Slide 73
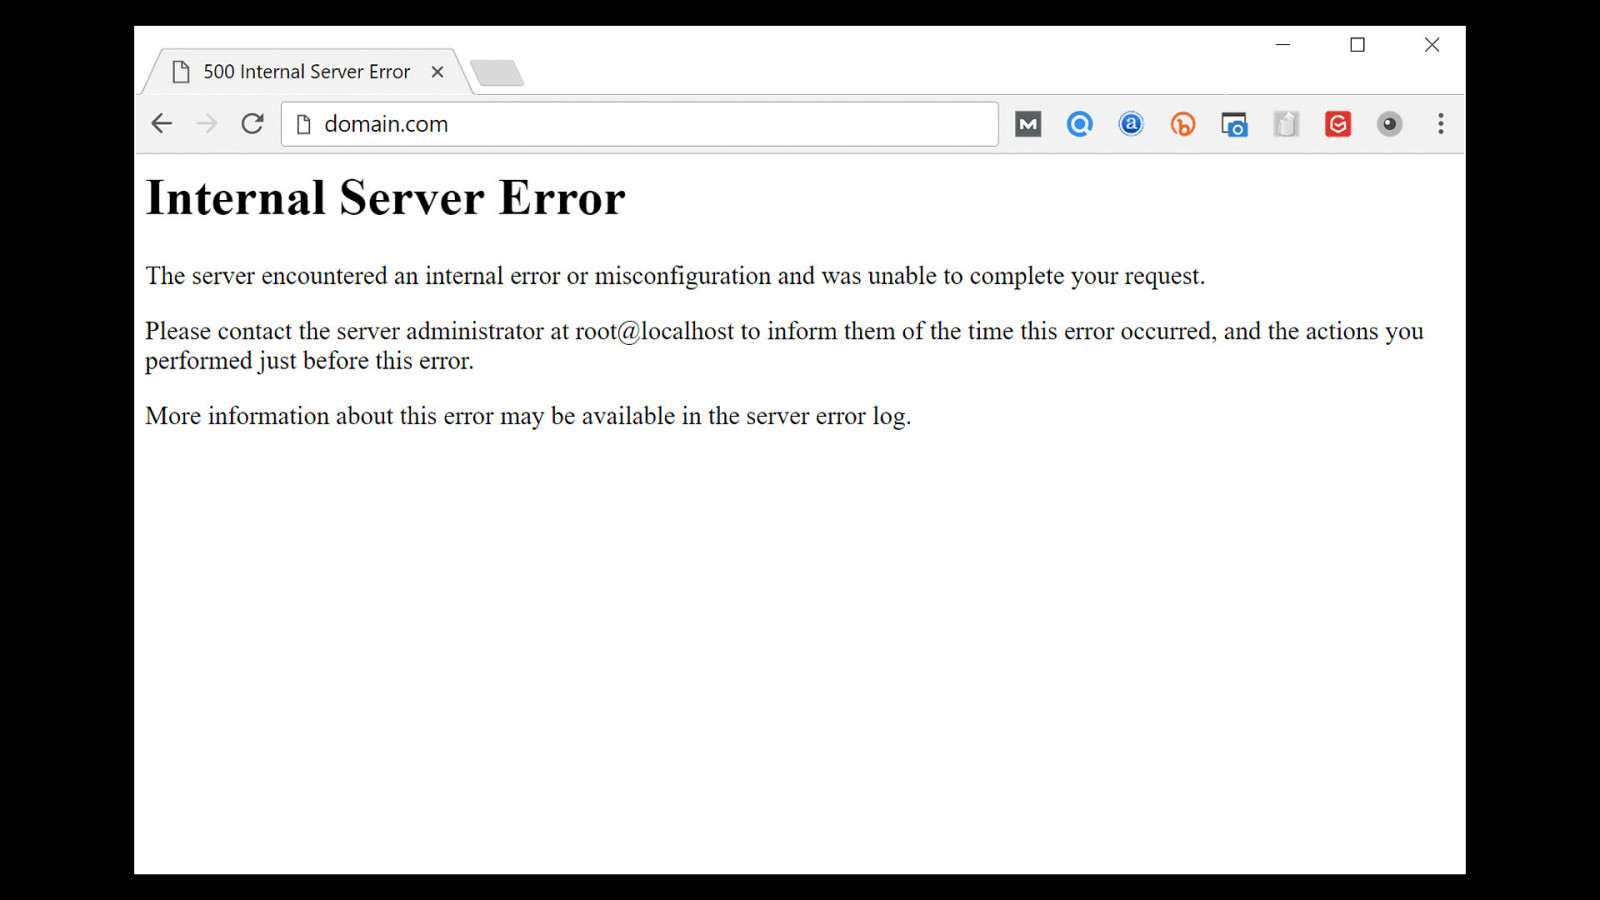
…or even worse a server error message that they likely don’t understand! For users who aren’t technically savvy, I’d imagine the screenshot displayed on the slide would be highly stressful. Do the users even know or care what a server is? Probably not, they only want to visit your site, complete a task, and get on with their lives!
Slide 74
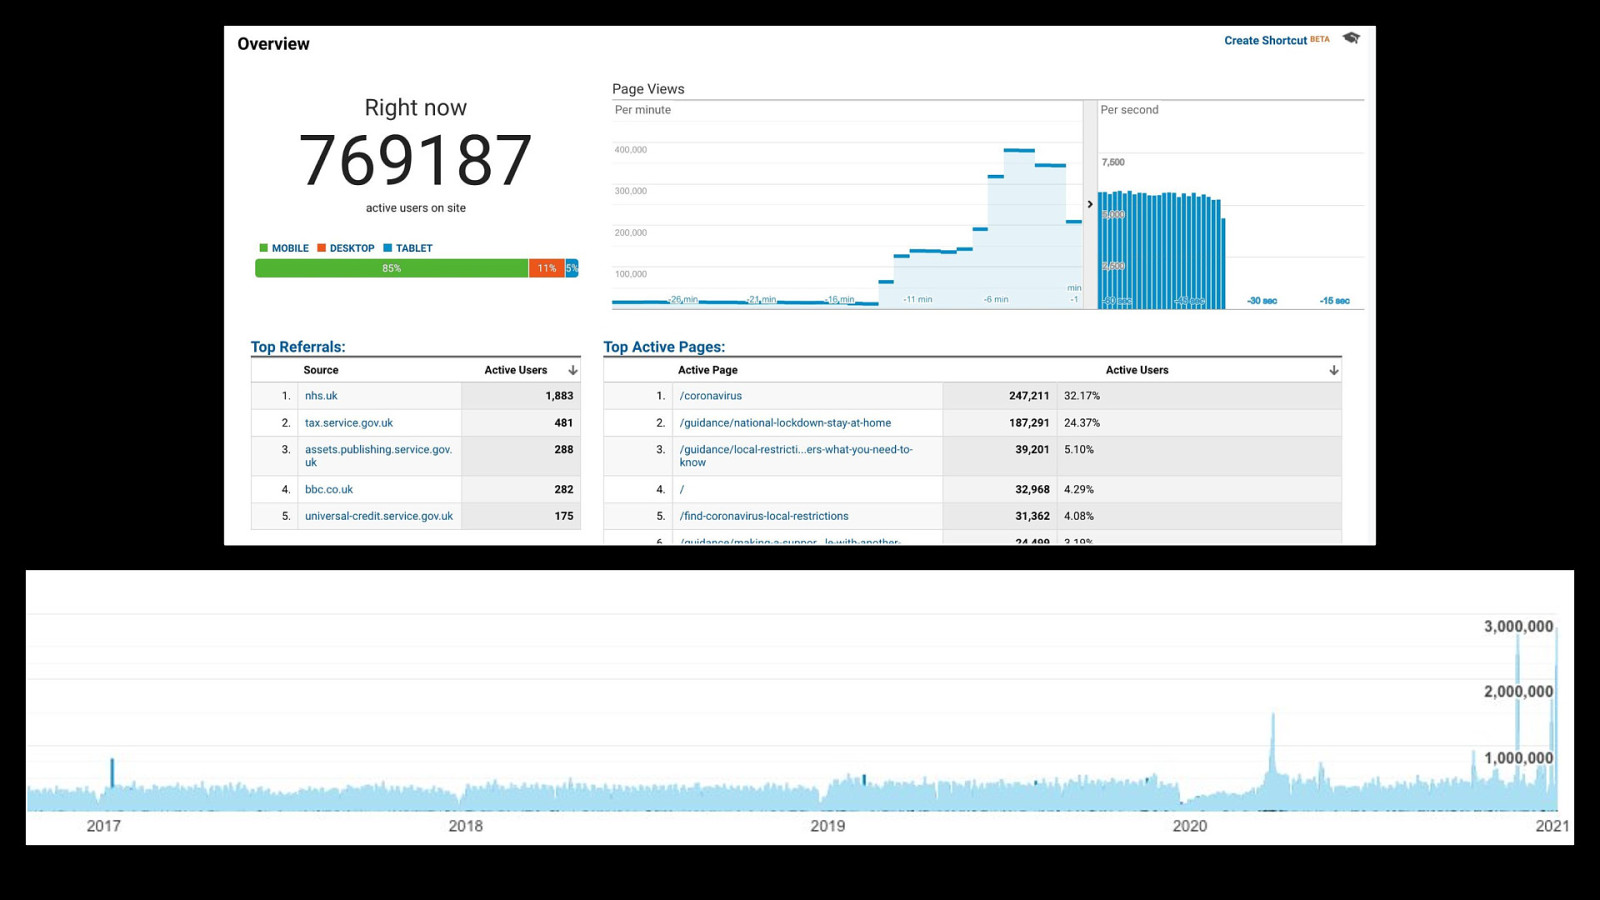
Referring back to the GOV.UK’s busiest day I mentioned earlier in the talk. This is what the sites traffic looked like in Google Analytics. 760,000+ concurrent users hitting the website looking for life-saving COVID-19 information…
Slide 75
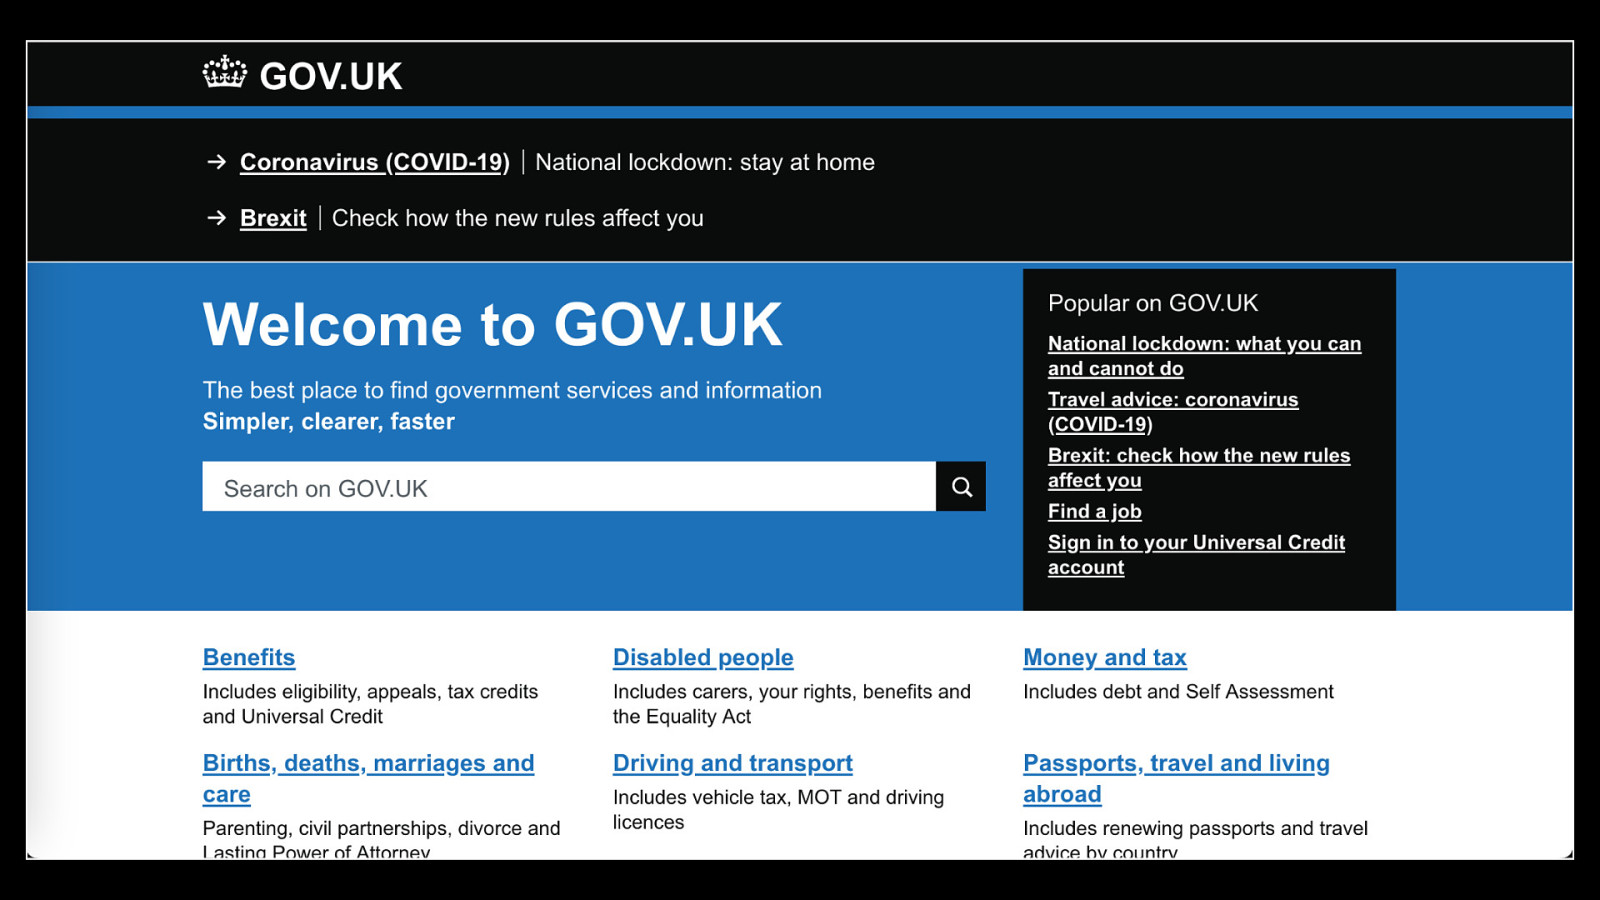
Thankfully, due to GOV.UK’s use of a CDN this is what the users saw: Yes, it’s pretty unremarkable. The users saw the standard GOV.UK homepage. With all the important information and news about, the National lockdown, COVID-19 travel advice, and Brexit all still available to read.
Slide 76
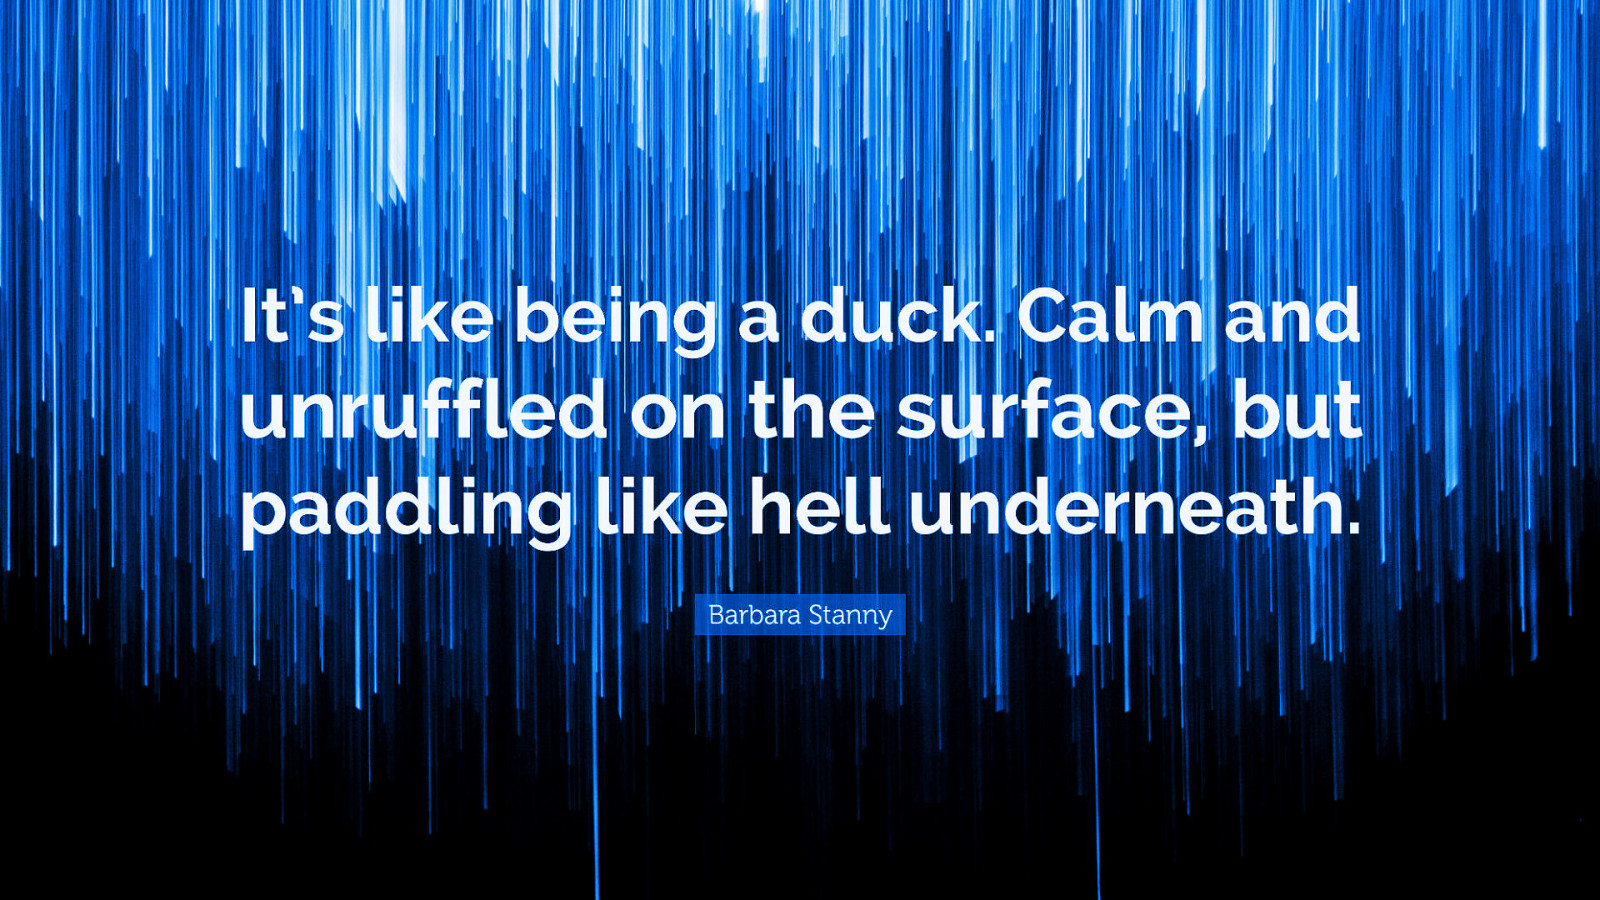
I think this is a great quote, that sums up CDN’s quite well: “It’s like being a duck. Calm and unruffled on the surface, but paddling like hell underneath!”
Slide 77
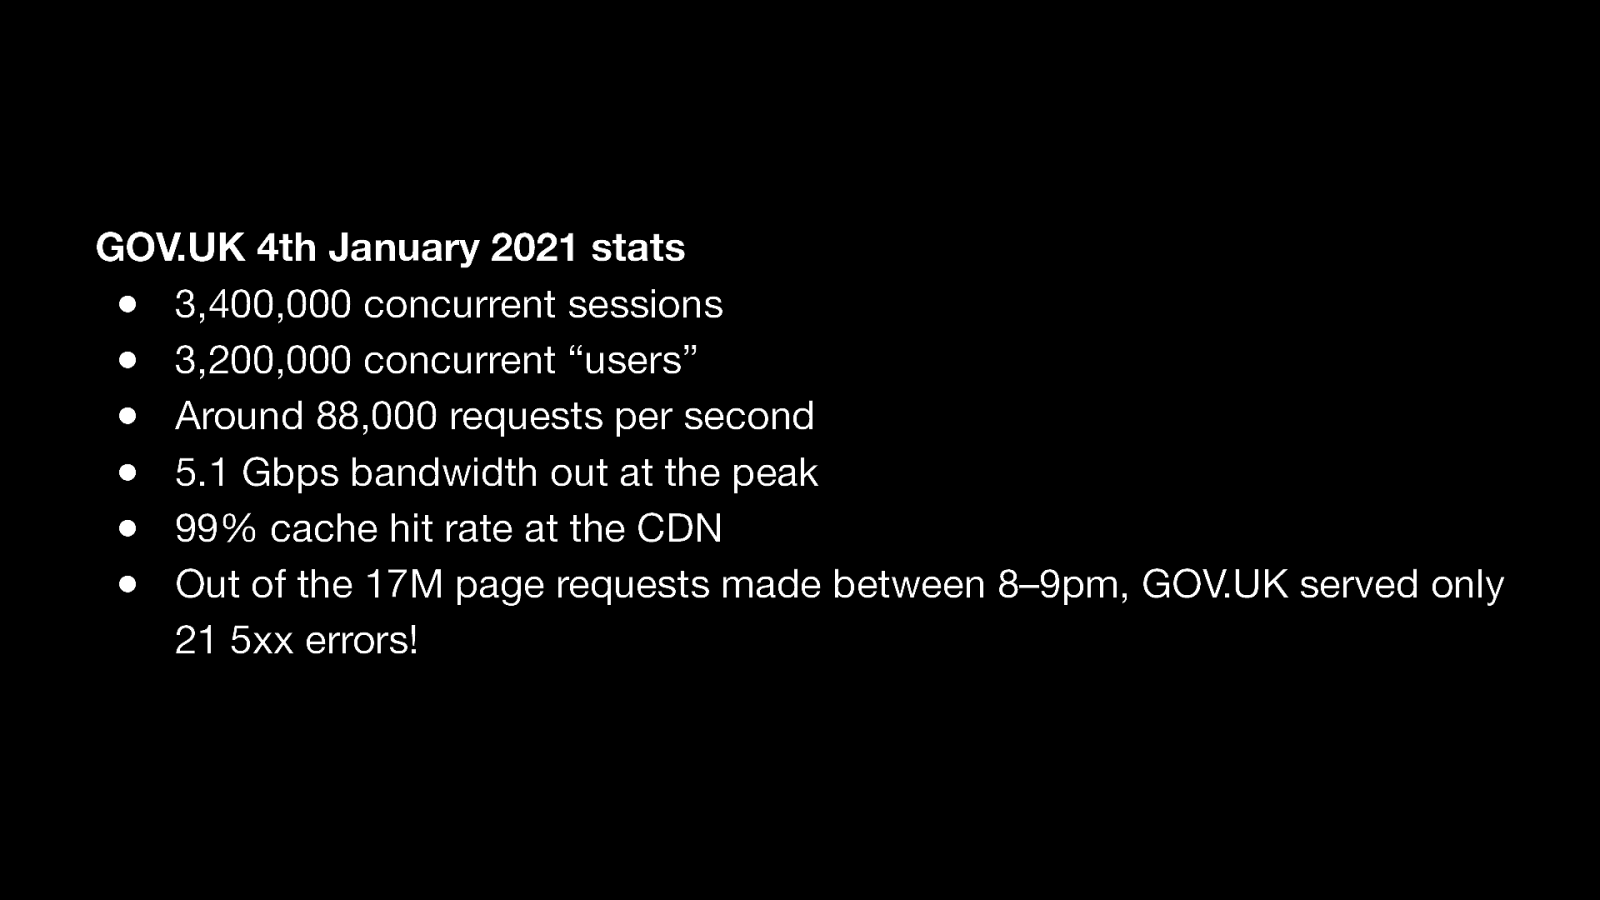
GOV.UK 4th January 2021 stats ● 3,400,000 concurrent sessions ● 3,200,000 concurrent “users” ● Around 88,000 requests per second ● 5.1 Gbps bandwidth out at the peak ● 99% cache hit rate at the CDN ● Out of the 17M page requests made between 8–9pm, GOV.UK served only 21 5xx errors! And it’s pretty much was happening, there are some impressive Fastly CDN stats from that day. ● ● ● ● Between 3.2 and 3.4 million concurrent users Approx 88,000 requests per second 99% cache hit rate at the CDN For 17M page views between 8 - 9pm, only 21, 500’ errors were served
Slide 78
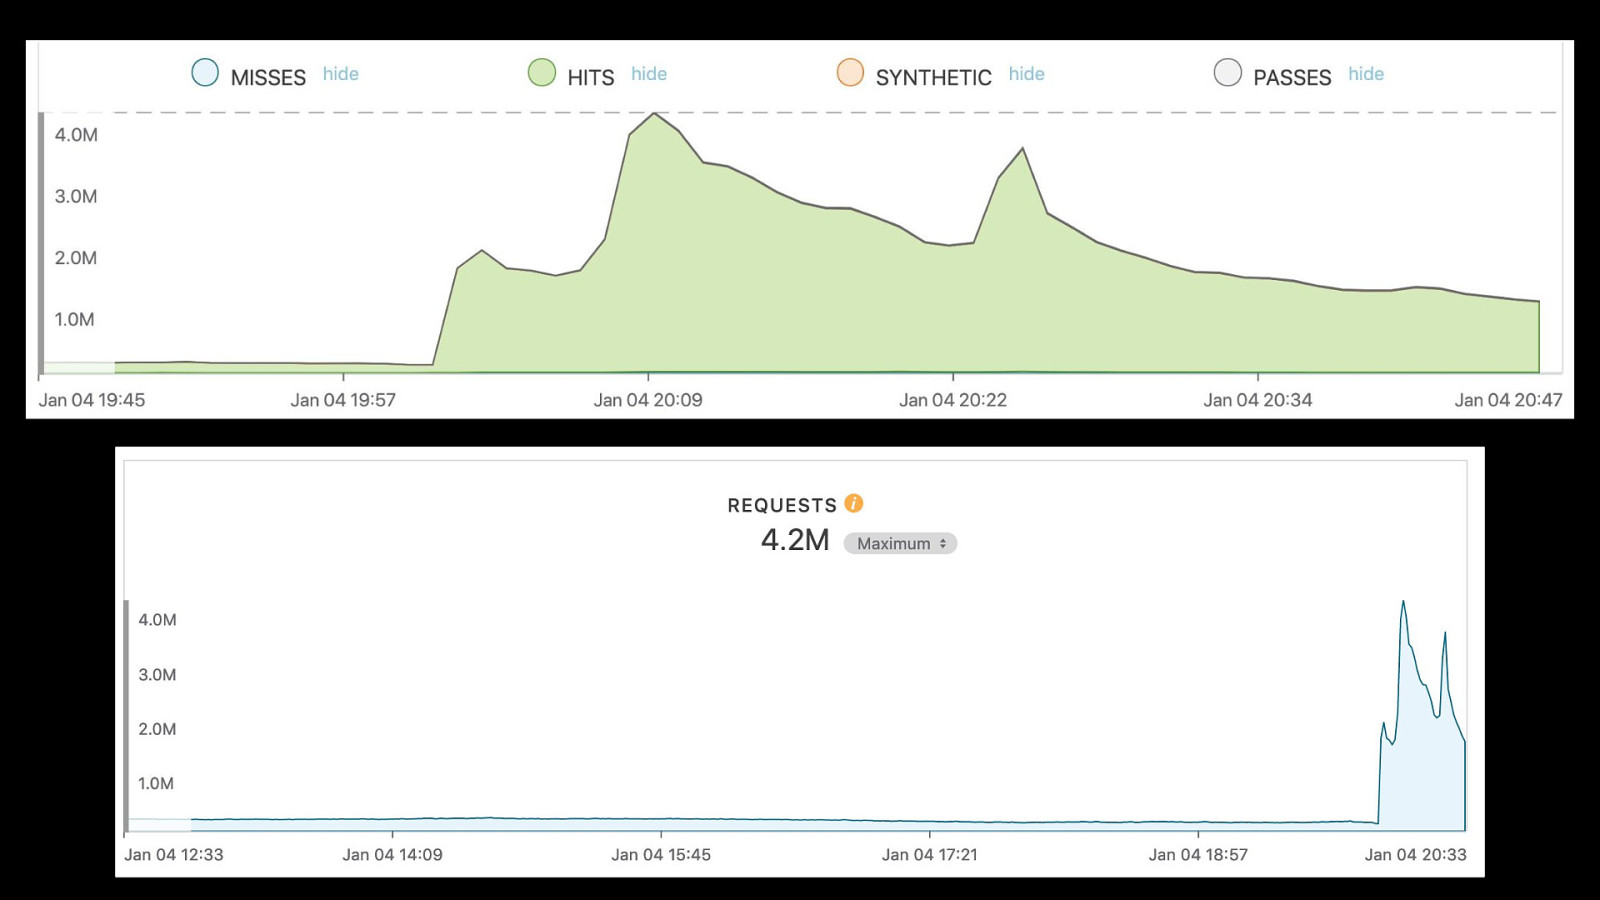
I personally, think that’s pretty impressive for a public service website, and without a CDN GOV.UK would have buckled under those huge user numbers. In turn this would have left their users without the vital, life saving information that they needed. Here are the same CDN stats in graph form. ● Top graph is the cache hit rate. ● Bottom graph is the number of concurrent requests hitting the CDN.
Slide 79
Accessibility While CDN’s bring increased web performance. If we take the literal meaning of the word, they also increase Accessibility. They do this by giving a much greater number of users globally, access to the information they serve.
Slide 80
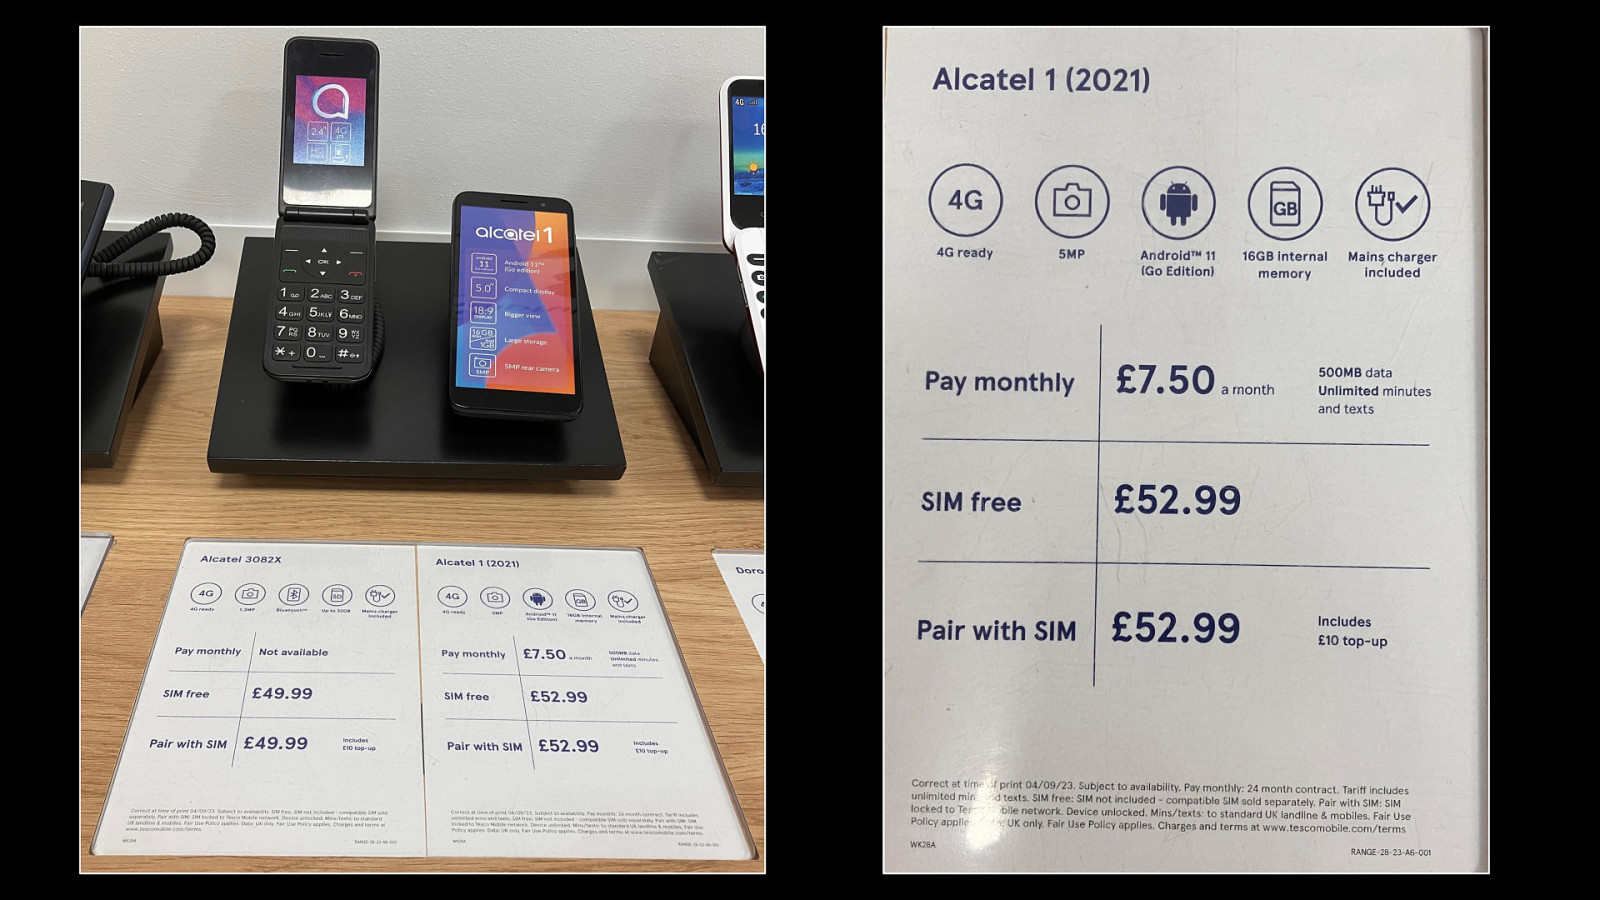
Another important service CDN’s are able to provide is optimised versions of content. For example, content that is specifically tailored for low-end devices. Like the one seen here, a low-spec Android device, available on PAYG for £52.99 in my local Tesco supermarket…
Slide 81
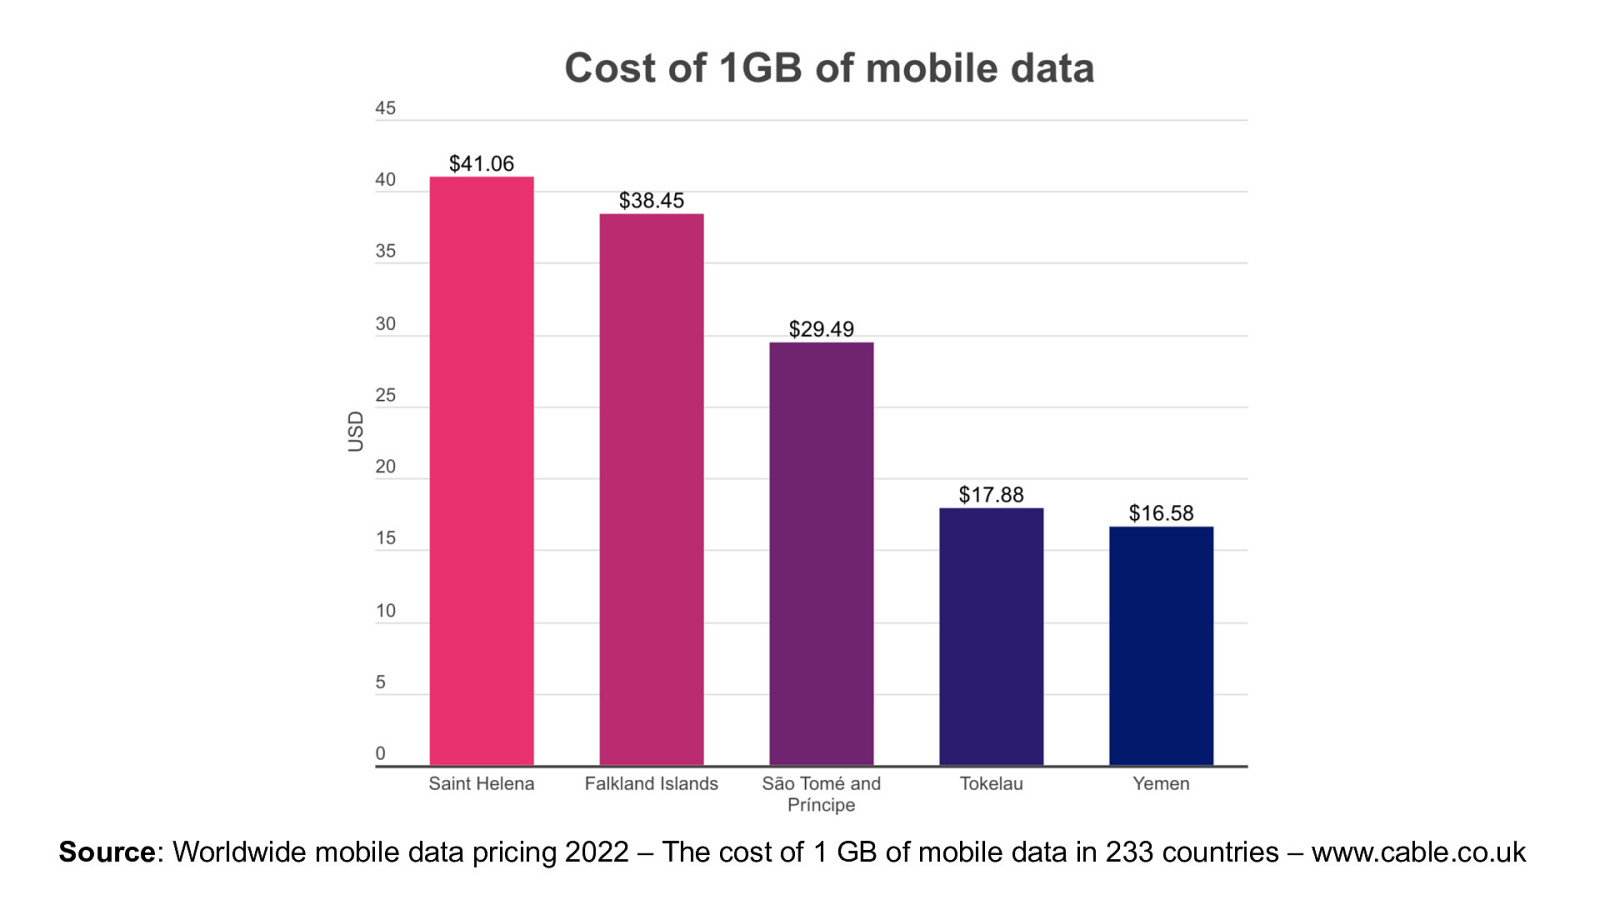
Source: Worldwide mobile data pricing 2022 – The cost of 1 GB of mobile data in 233 countries – www.cable.co.uk CDN’s also help users on limited and expensive data plans. Here we see that the Falkland Islands as the 2nd most expensive country in the world for mobile data, with 1GB costing upwards of £30!
Slide 82
If CDN providers align their services with the specific needs and challenges of underserved communities, they can contribute to bridging the digital divide and ensure that more people around the world can benefit from the opportunities provided by digital technology. In summary, CDN providers play a huge part in bridging the Digital divide. From improved access to the internet and reducing the cost for users. They also enhance performance, provide resilience, and scalability for critical online services. [DRINK]
Slide 83
- Data Compression Number 5: Data Compression. Since we’ve been talking about CDN’s, it a great time to mention data compression too. Data compression helps reduce the size of data sent over the network. Improving page load times and reducing data usage. This is critical for users on limited data plans. A reduction in the amount of data transferred will also lead to energy savings. This is not only good for the environment but also translates into cost savings for users.
Slide 84

Source: Worldwide mobile data pricing 2022 – The cost of 1 GB of mobile data in 233 countries – www.cable.co.uk As we saw in this previous slide, people on Saint Helena and the Falkland islands need as much help as they can when it costs upwards of £30 per GB of data!
Slide 85
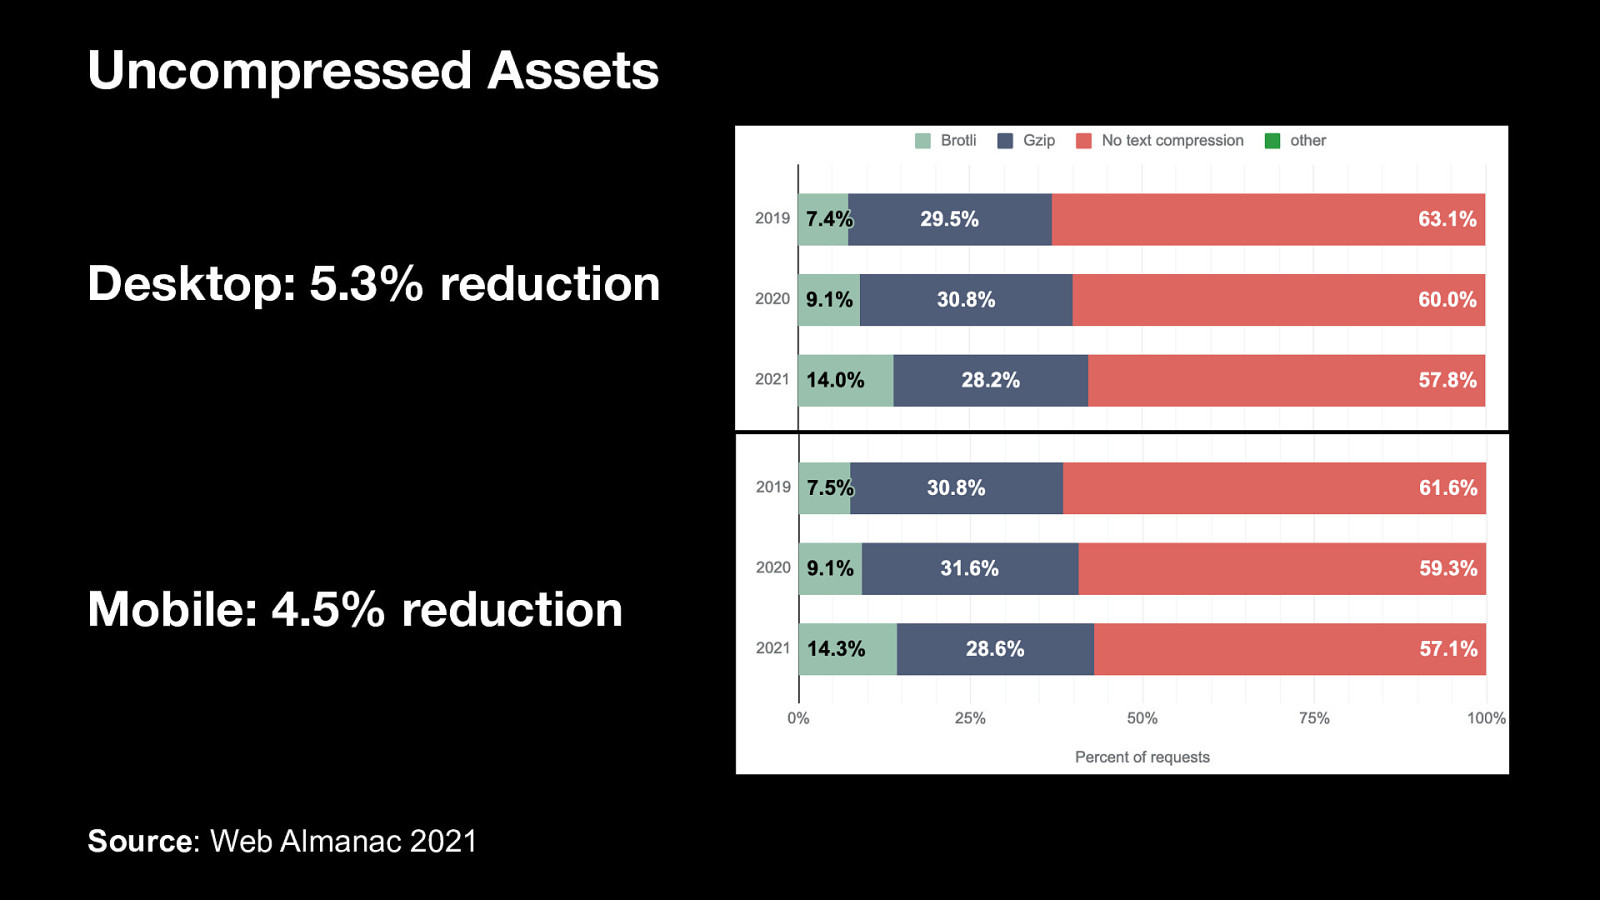
Uncompressed Assets Desktop: 5.3% reduction Mobile: 4.5% reduction Source: Web Almanac 2021 This is also where data compression can help rural users. Thankfully, over the past few years the number of websites enabling some form of compression for their assets has been increasing. The graphs on the slide show the drop in uncompressed requests between 2019 and 2021: ● For Desktop users this is 5.3%. ● For mobile users it’s a little less at only 4.5%
Slide 86
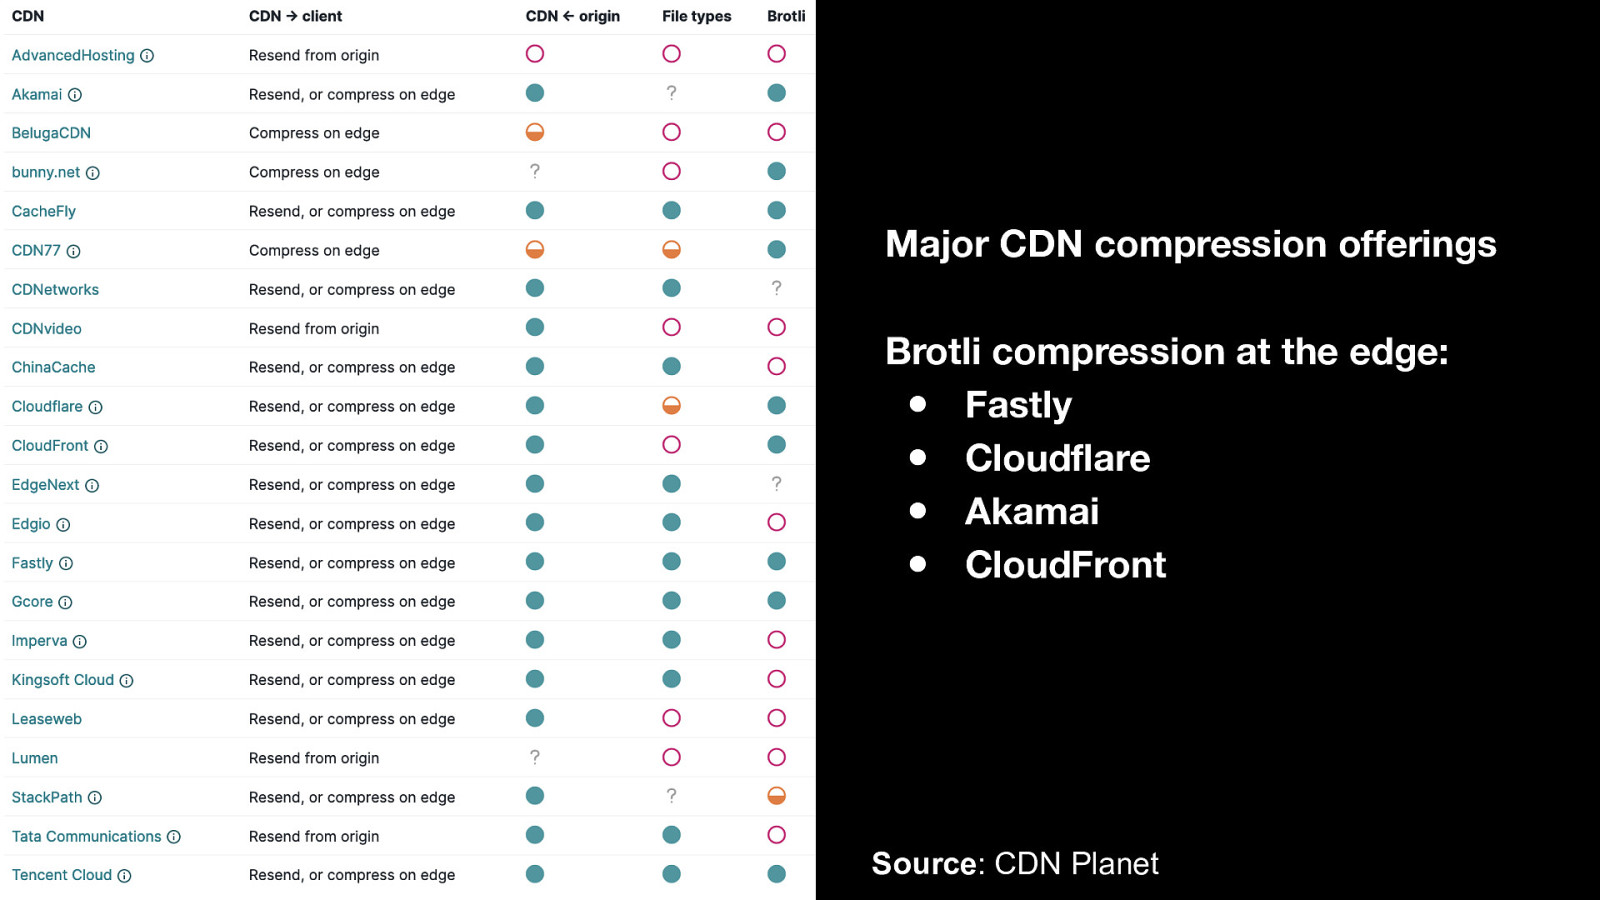
Major CDN compression offerings Brotli compression at the edge: ● Fastly ● Cloudflare ● Akamai ● CloudFront Source: CDN Planet It’s actually getting easier for developers to enable data compression on their websites. With many CDN’s offering asset compression at the touch of a button. Compression at the Edge is perfect for lazy developers where the uncompressed file is fetched from the origin. Then compressed on-the-fly by the CDN. It’s possible to do this automatically when assets are updated too. It really can be a set it and forget it solution. The use of Brotli compression will reduce data over the network even further. With many of the major CDN’s now supporting it by default.
Slide 87
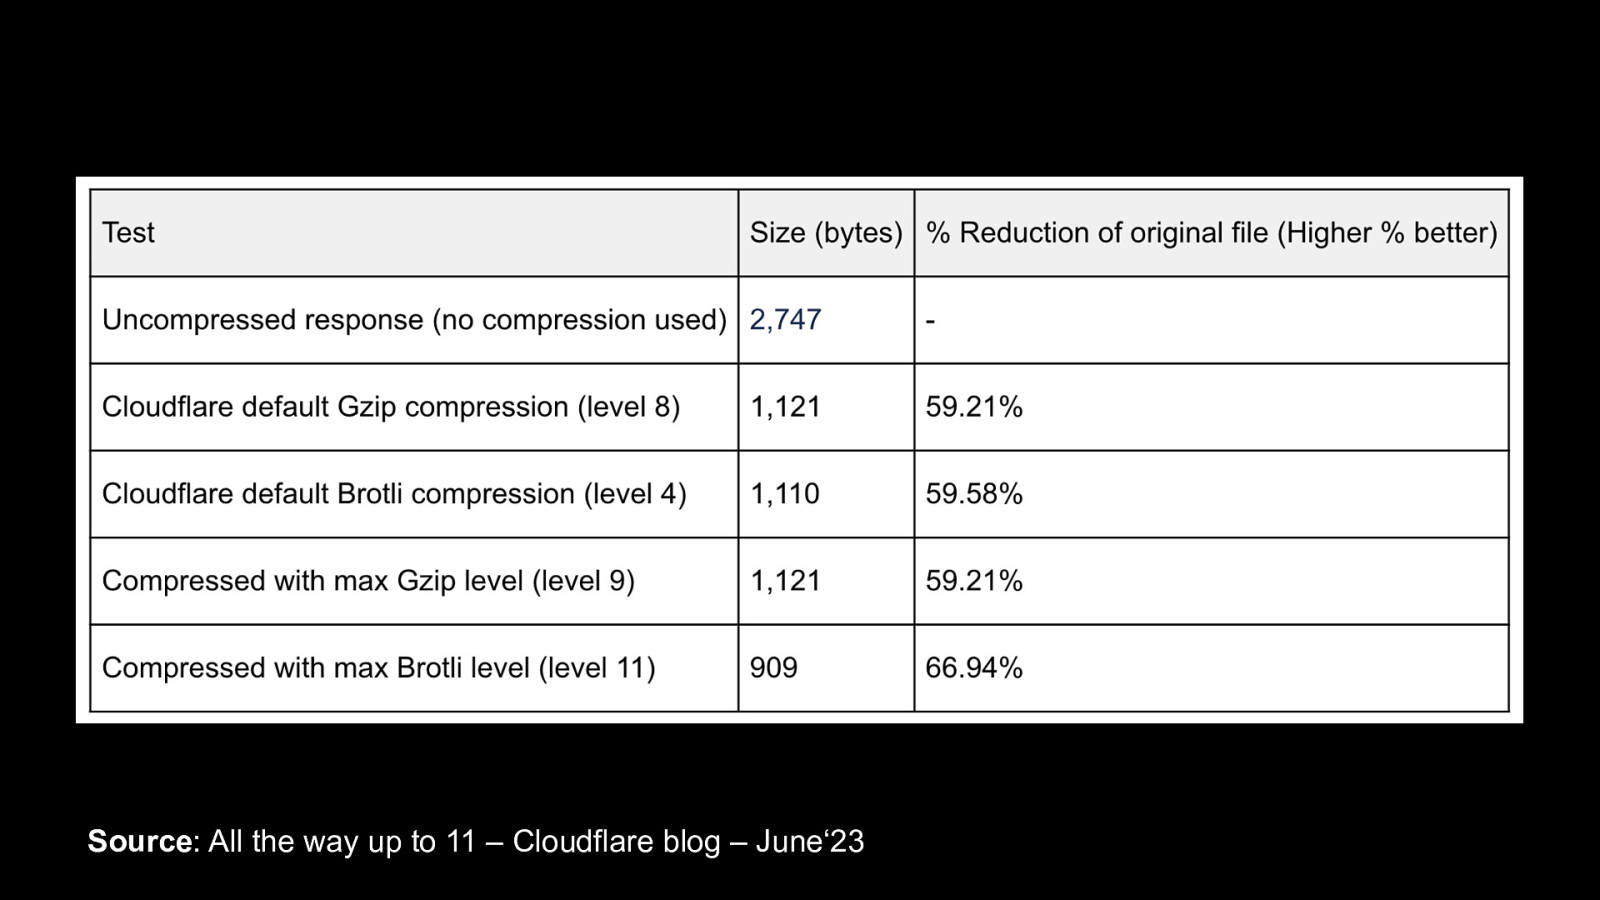
Source: All the way up to 11 – Cloudflare blog – June‘23 According to Cloudflare: “By compressing Brotli at level 11, developers are able to reduce their file sizes by 19% compared to the best Gzip compression level”
Slide 88
“…by utilizing Brotli compression, particularly at its highest levels, which can lead to improved website performance, faster page load times…” Source: All the way up to 11 – Cloudflare blog – June ‘23 They later go on to say how utilizing Brotli at its highest compression levels can lead to improved website performance and faster page load times.
Slide 89

Source: Worldwide mobile data pricing 2022 – The cost of 1 GB of mobile data in 233 countries – www.cable.co.uk I’m sure the folks in this graph would love a 19% reduction in their data usage! At these prices, 19% would save them a small fortune.
Slide 90
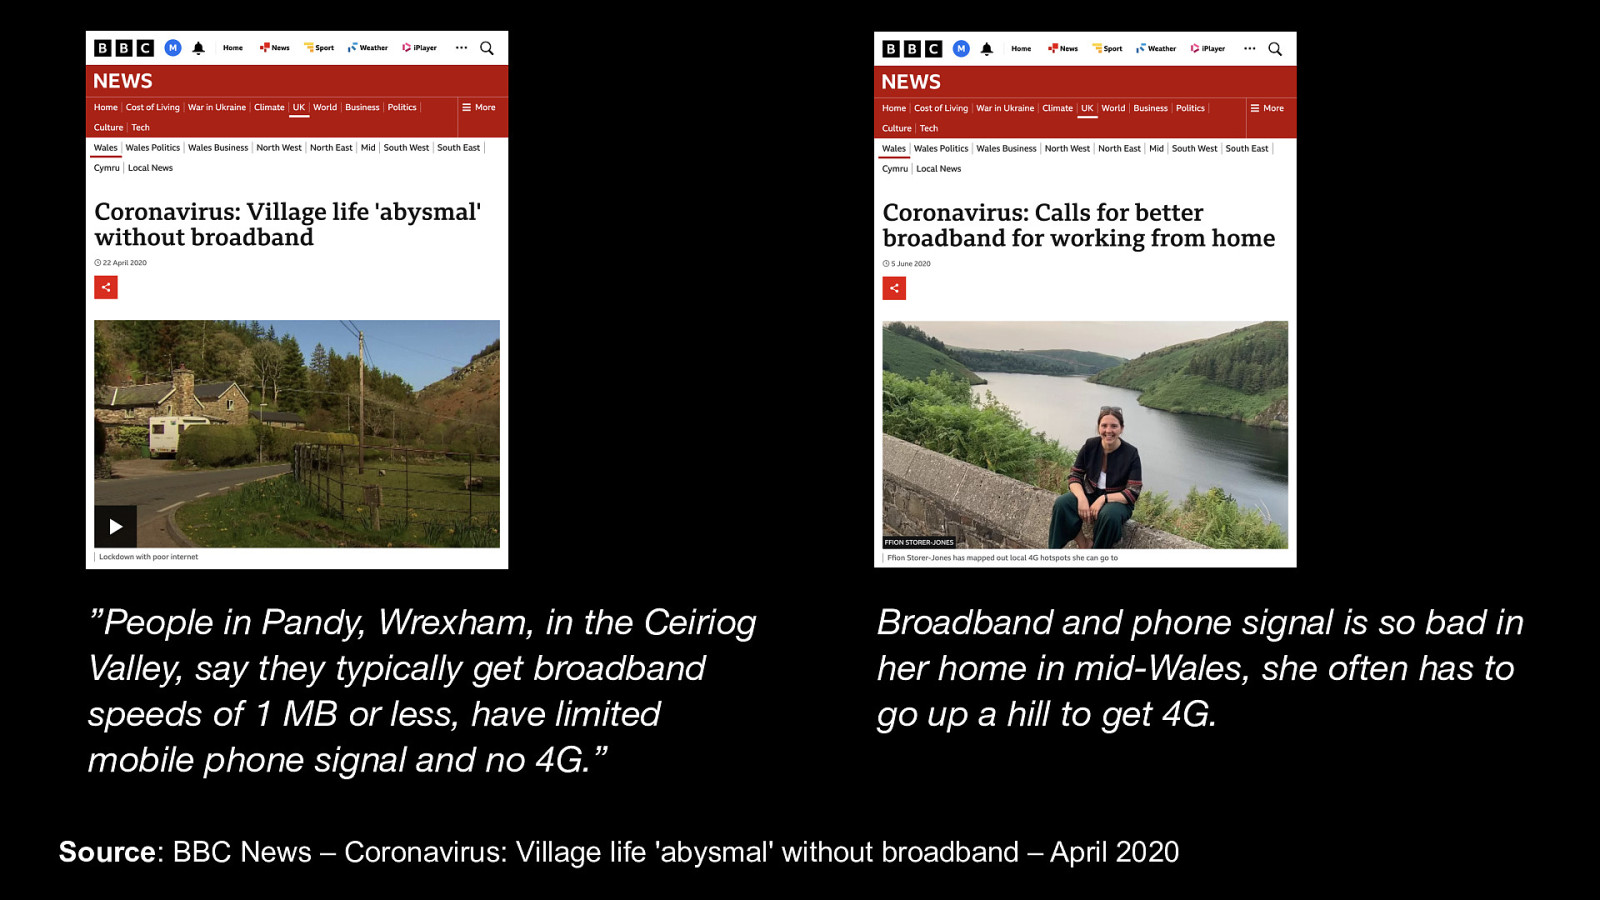
”People in Pandy, Wrexham, in the Ceiriog Valley, say they typically get broadband speeds of 1 MB or less, have limited mobile phone signal and no 4G.” Broadband and phone signal is so bad in her home in mid-Wales, she often has to go up a hill to get 4G. Source: BBC News – Coronavirus: Village life ‘abysmal’ without broadband – April 2020 And it isn’t all about remote islands in the south Atlantic that have this issue. These BBC articles from 2020 describe how the residents of rural villages in Wales feel totally isolated and forgotten. They talk about having to walk up hills just to get a mobile signal, and one article even mentions how their village hasn’t got reliable radio and TV signals either!
Slide 91
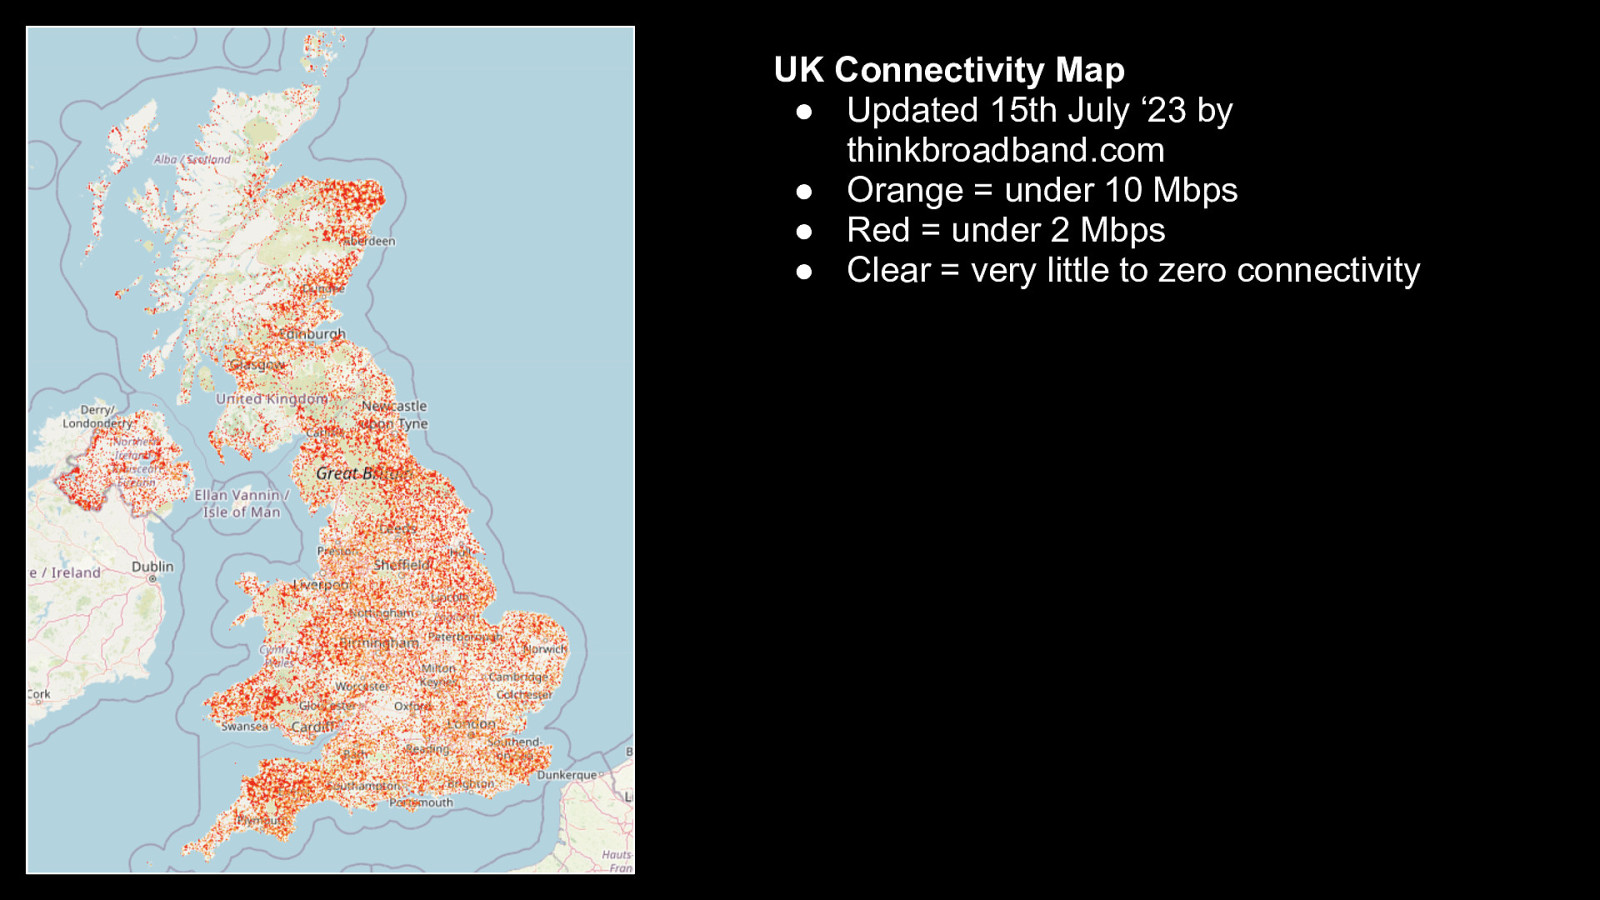
UK Connectivity Map ● Updated 15th July ‘23 by thinkbroadband.com ● Orange = under 10 Mbps ● Red = under 2 Mbps ● Clear = very little to zero connectivity Going back to the map I showed earlier in the talk, this is an issue across the whole of the United Kingdom. It’s currently known as a “Postcode Lottery” in the UK whether you get a fast connection or not.
Slide 92
Data compression can help reduce the size of data sent over the network, improving load times and reducing data usage, which can be critical for users with limited data plans. In summary, data compression has a vital part to play in bridging the digital divide. It reduces data sent over the network and improves page load times. More importantly, less data usage allows users on limited data plans and in rural areas to gain access to the information they need. No matter where they are, or the device they are using. I believe Pat Meenan’s talk on ‘Compression Dictionaries’ later today will cover some upcoming improvements for data compression. [DRINK]
Slide 93
- Offline Capabilities & PWA’s Number 6: Offline Capabilities & Progressive Web Apps. The last topic I will briefly touch on is the Web platforms offline capabilities. And discuss if they can help when it comes to the Digital Divide. The Web platform has a powerful set of API’s that are designed to help users who struggle with connectivity issues. The key API I’m talking about is the Service Worker API…
Slide 94
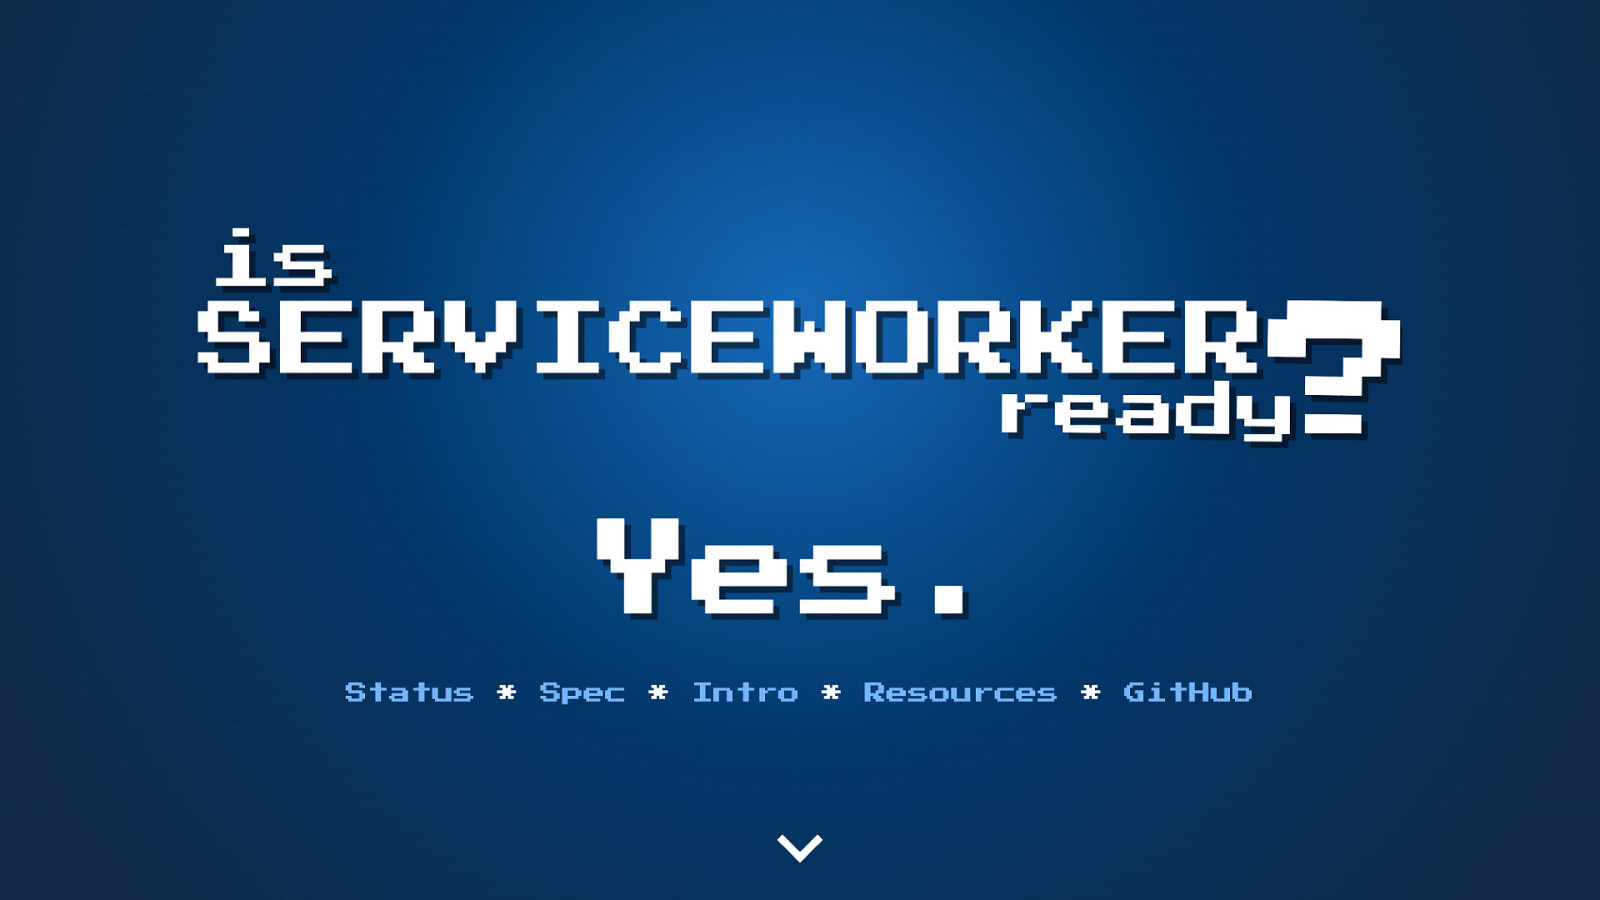
…is the Service Worker API ready to be used? Well according to Jake Archibald one of the W3C API authors: Yes it is, and there’s a whole website here saying it is!
Slide 95
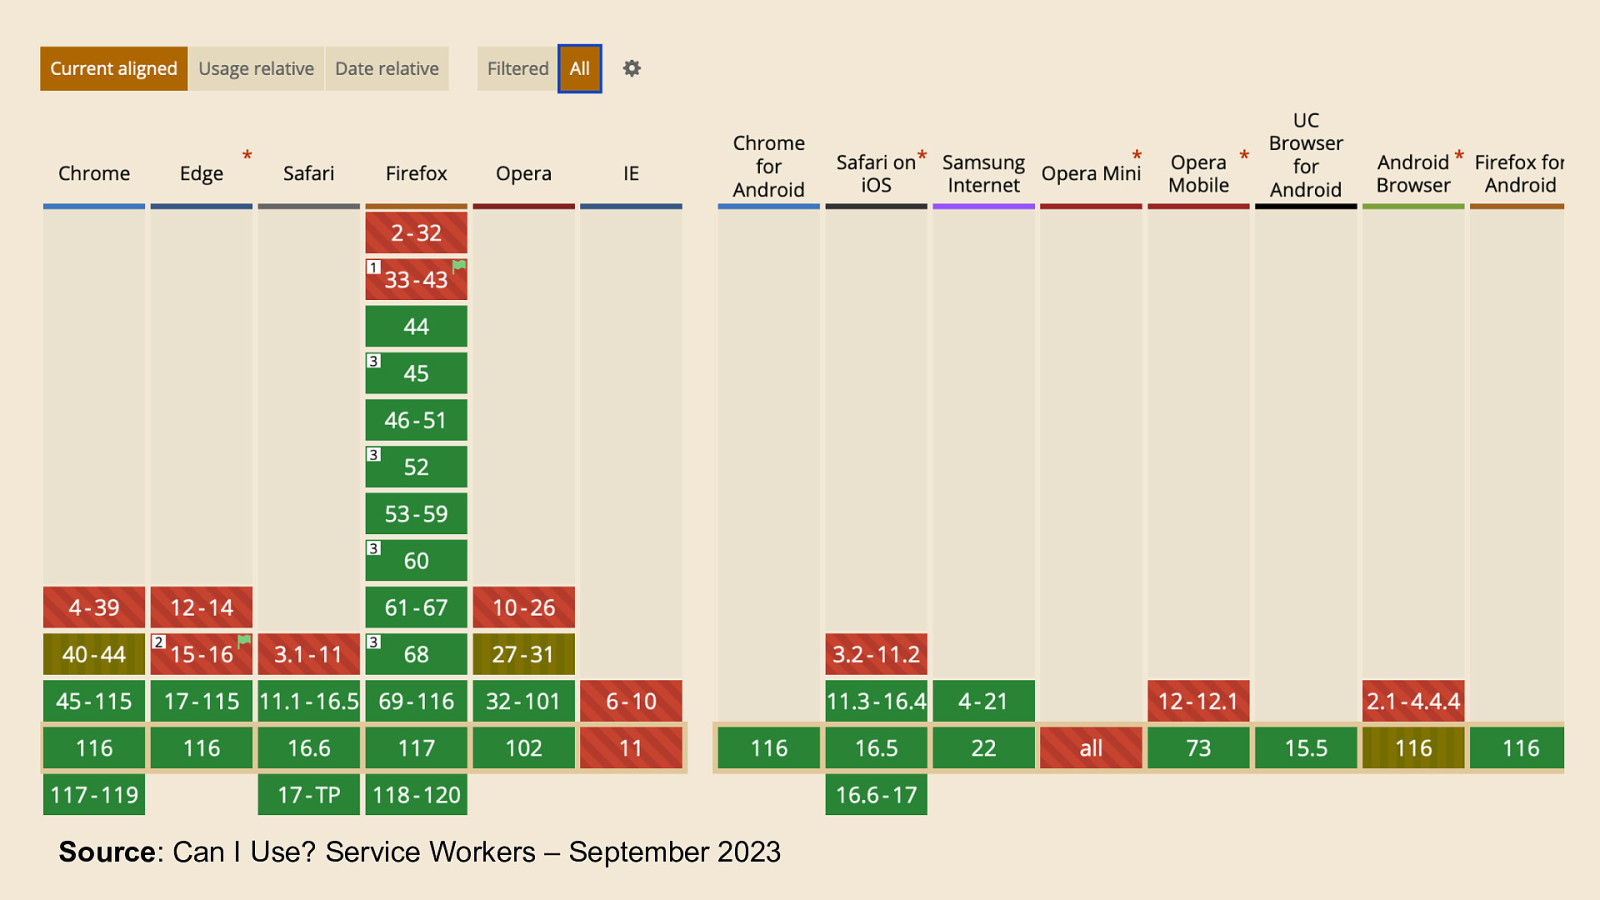
Source: Can I Use? Service Workers – September 2023 And the Web Platform information website “Can I use” is in agreement. With 94.4% of users globally currently using a browser that supports the API.
Slide 96
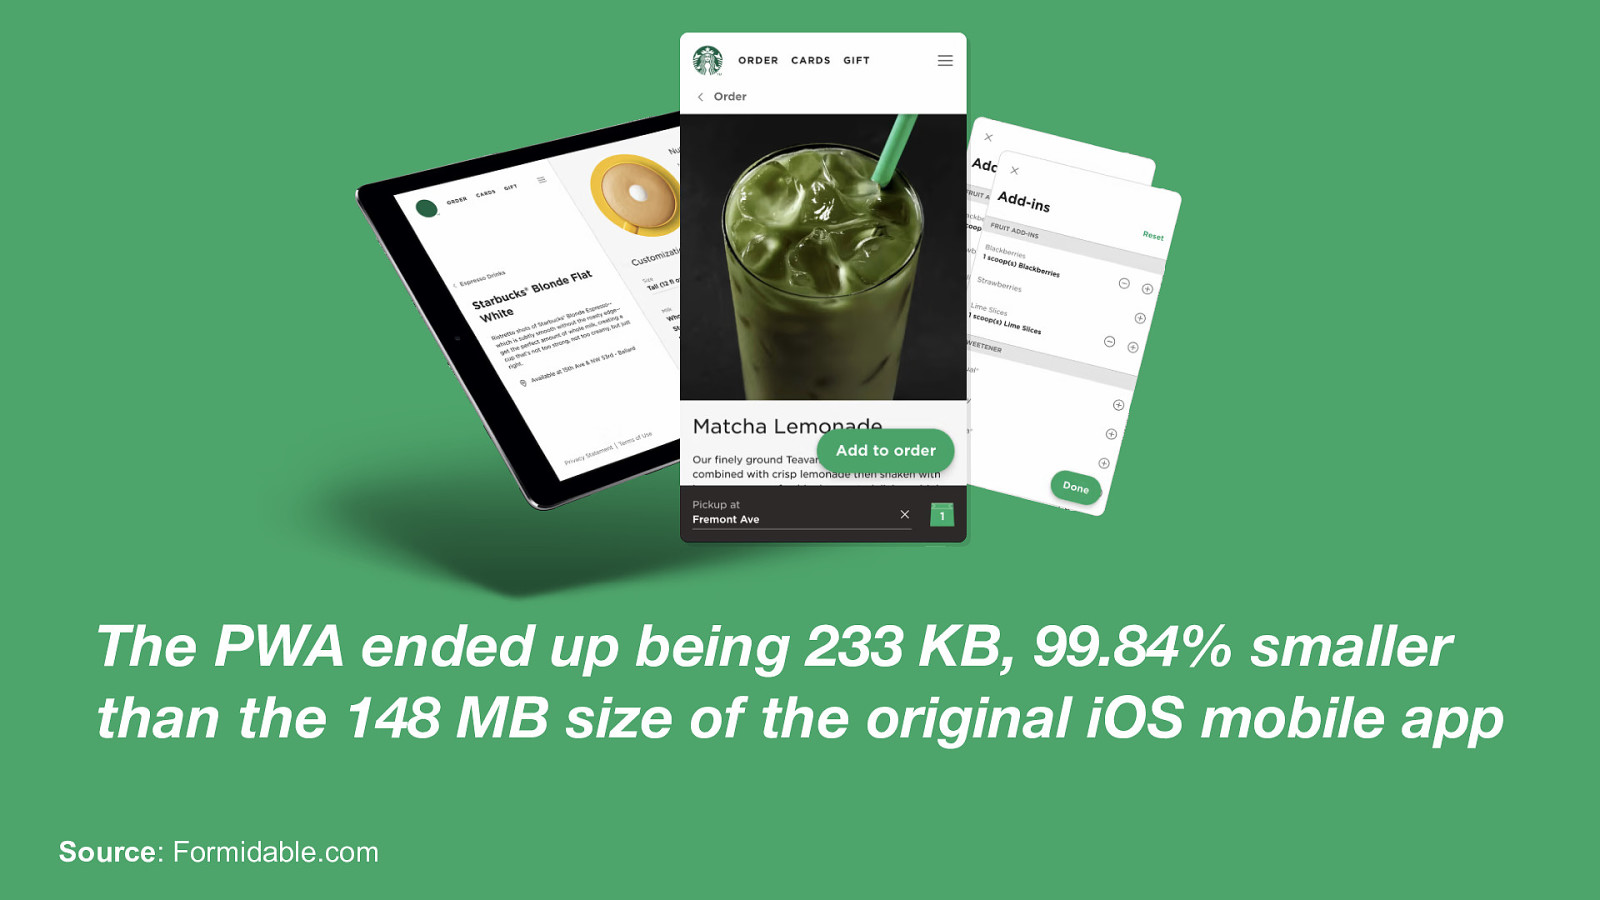
The PWA ended up being 233 KB, 99.84% smaller than the 148 MB size of the original iOS mobile app Source: Formidable.com The natural progression from the Service Worker API is Progressive Web Apps. These apps leverage the Service Worker API to allow web applications to access “native” device features. One of the standout PWA’s that is often cited is the Starbucks store locator and easy ordering app. The success of the App comes with some pretty impressive Web performance stats. The native Starbucks App was a hefty 148 MB to download, a huge download for low-data users. The PWA version came in at 233 KB a whopping 99.84% smaller! This lead to improved order diversity by 23%! The lightweight app opened up Starbucks to a larger user base. Simply because there wasn’t the 148 MB barrier to entry to get to their digital storefront.
Slide 97

Having said all this I personally believe using PWA’s for web performance and reducing the digital divide could likely be a double edged sword (don’t get any ideas Robin!): ● Yes, you get very fine-grained control over caching and a much smaller footprint than a native app. ● But on the flip side how do you explain this concept to someone who is less tech savvy or even scared of technology? For example: when a user first visits, it’s a website, but then it becomes a “native” app on their phones home screen. Is the user left asking: ● “Why is this website asking me to add something to my homescreen?” ● “What’s a homescreen? ● “Why is it now an App?” ● “Why didn’t it use the App store?” This could be a very confusing user experience! I’d struggle to explain this concept to my parents. And even my younger sister, who are all daily tablet and phone users, but aren’t heavily into technology, like I am.
Slide 98

I personally feel that PWA’s may be a bridge too far for many non-technical users. But I’d love to hear if anyone has had success using PWA’s and users with limited digital skills? Maybe it’s a topic to discuss later over lunch? So that’s pretty much the end of my talk. I only have a few more slides before I finish… [DRINK]
Slide 99
The #webperf community is wonderful! I’d like to take this opportunity to thank you, the whole Web Performance community. As the past few years have been pretty rough for my family and I.
Slide 100

As I mentioned earlier. Back in April 2021, I was diagnosed with a grade 3 brain tumour. Completely unforeseen, after having had no symptoms at all. Upon seeing the size and location of the cancer, I was pretty certain that I’d just been handed a death sentence. And that I’d be lucky to get to my 40th Birthday in the December of that year.
Slide 101

While waiting 6-months for my brain surgery, the Web Performance community were there to keep me occupied and help me get over the life-changing news.
Slide 102

A few kind folks even banded together to buy me the 7,500 piece Lego Millennium Falcon to keep me occupied during my recovery. My Son’s and I were blown away when I opened the box! But after 7-hours of awake, open-head brain surgery, 33 rounds of radiotherapy, and 4 cycles of chemotherapy. Thanks to the wonderful National Health Service, and the miracle of modern medicine, I’m still here! So I’ll hopefully get to buy: ● Tammy Everts ● Andrew Betts ● Barry Pollard ● Patrick Meenan ● Cliff Crocker and Andy Davies, a nice cold Dutch beer as a thank you over the next day or so!
Slide 103
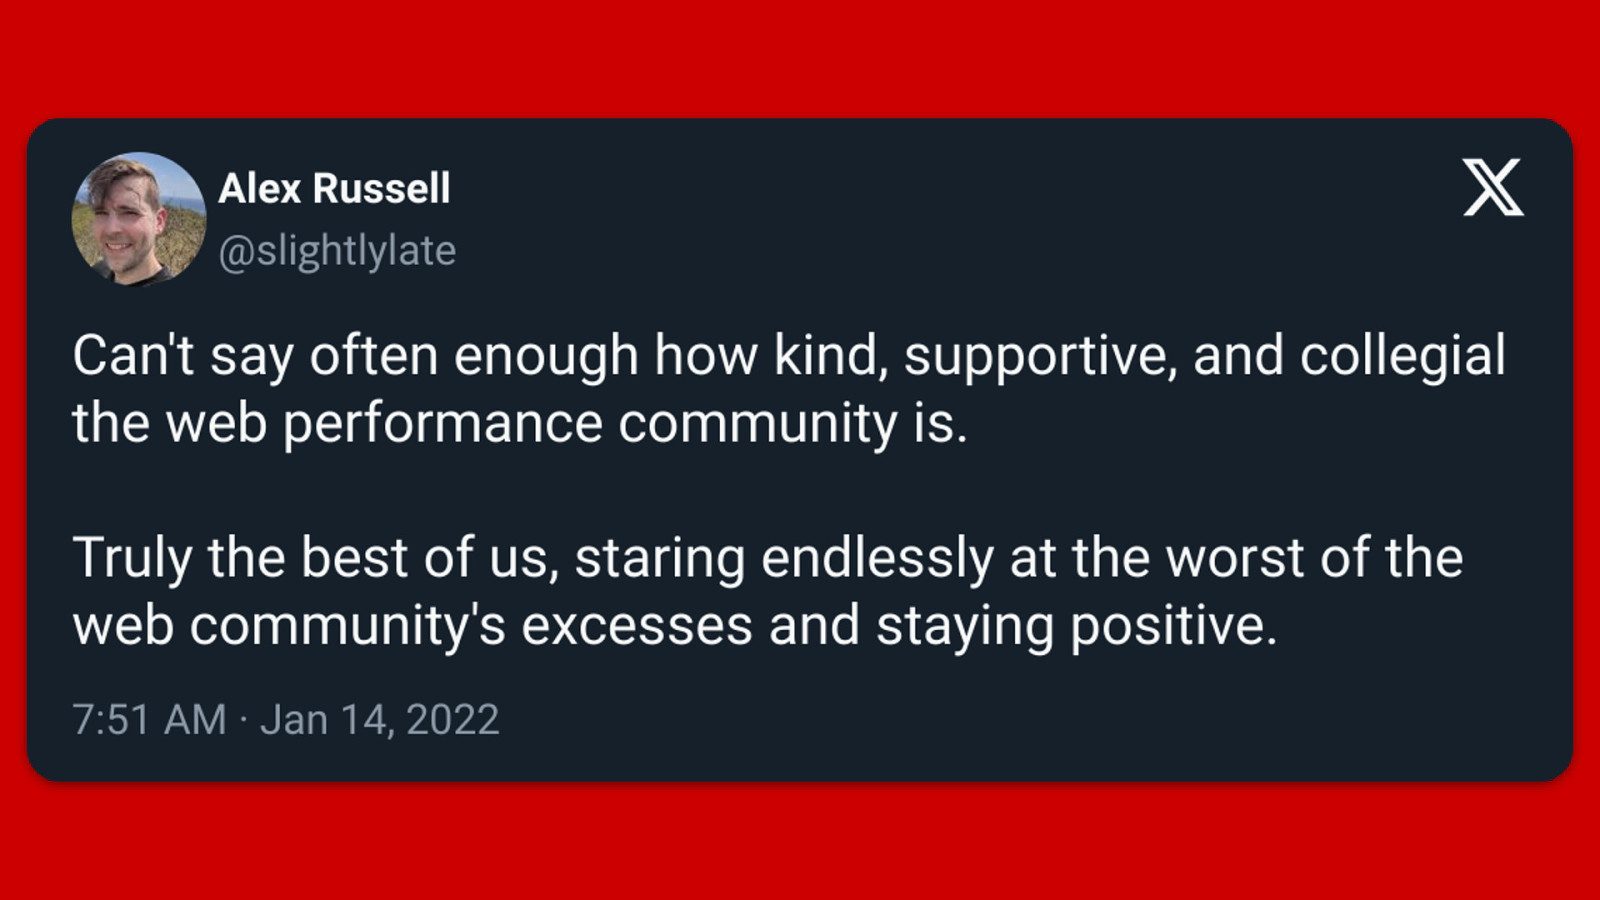
And I’m not the only person to comment on this fact, I saved this tweet from Alex Russell where he comments: “I can’t say often enough how kind, supportive, and collegial (kuh·lee·jee·uhl) the web performance community is. Truly the best of us, staring endlessly at the worst of the web community’s excesses and staying positive.” A comment I completely agree with!
Slide 104

Fin! Thanks for listening! Matt Hobbs Twitter: @TheRealNooshu Mastodon: @[email protected] And that’s the end of my talk, thanks for listening. I hope you found it interesting, I just want to take a second to mention that I’m currently looking for my next job role. So if you, or anyone you know are hiring please do get in contact with me. I have a list of all my sources on the final slide. Any questions?
Slide 105
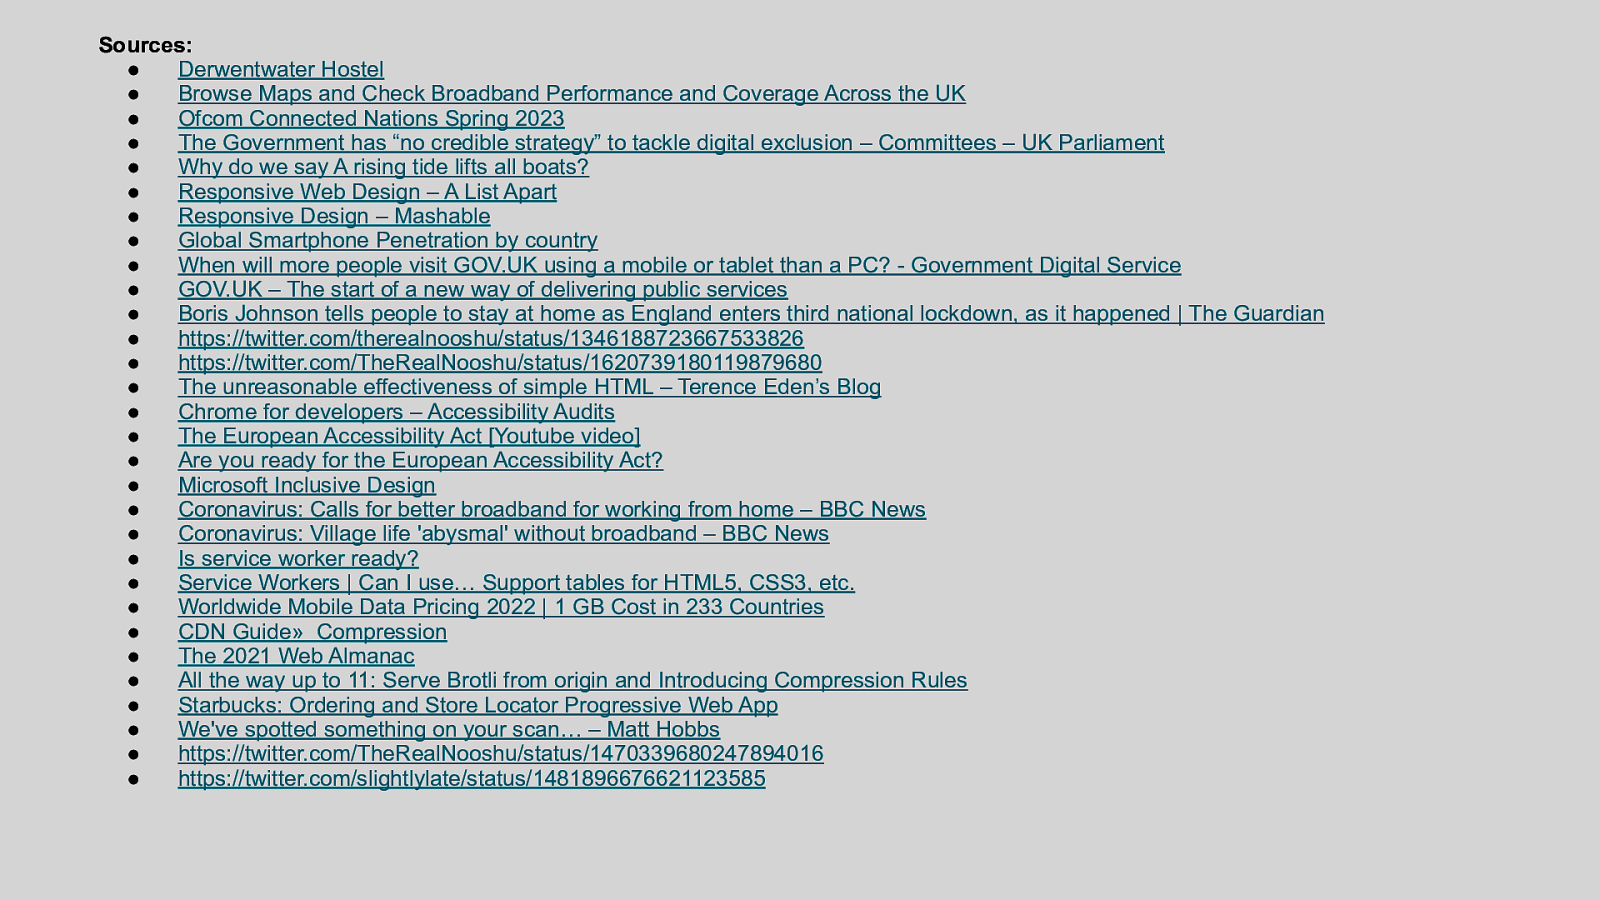
Sources: ● Derwentwater Hostel ● Browse Maps and Check Broadband Performance and Coverage Across the UK ● Ofcom Connected Nations Spring 2023 ● The Government has “no credible strategy” to tackle digital exclusion – Committees – UK Parliament ● Why do we say A rising tide lifts all boats? ● Responsive Web Design – A List Apart ● Responsive Design – Mashable ● Global Smartphone Penetration by country ● When will more people visit GOV.UK using a mobile or tablet than a PC? - Government Digital Service ● GOV.UK – The start of a new way of delivering public services ● Boris Johnson tells people to stay at home as England enters third national lockdown, as it happened | The Guardian ● https://twitter.com/therealnooshu/status/1346188723667533826 ● https://twitter.com/TheRealNooshu/status/1620739180119879680 ● The unreasonable effectiveness of simple HTML – Terence Eden’s Blog ● Chrome for developers – Accessibility Audits ● The European Accessibility Act [Youtube video] ● Are you ready for the European Accessibility Act? ● Microsoft Inclusive Design ● Coronavirus: Calls for better broadband for working from home – BBC News ● Coronavirus: Village life ‘abysmal’ without broadband – BBC News ● Is service worker ready? ● Service Workers | Can I use… Support tables for HTML5, CSS3, etc. ● Worldwide Mobile Data Pricing 2022 | 1 GB Cost in 233 Countries ● CDN Guide» Compression ● The 2021 Web Almanac ● All the way up to 11: Serve Brotli from origin and Introducing Compression Rules ● Starbucks: Ordering and Store Locator Progressive Web App ● We’ve spotted something on your scan… – Matt Hobbs ● https://twitter.com/TheRealNooshu/status/1470339680247894016 ● https://twitter.com/slightlylate/status/1481896676621123585 Thanks again!